Nigerian College, Under 1 year

COMPARE

Nigerian
Race
Ancestry
AfghanAfricanAlaska NativeAlaskan AthabascanAlbanianAleutAlsatianAmericanApacheArabArapahoArgentineanArmenianAssyrian/Chaldean/SyriacAustralianAustrianBahamianBangladeshiBarbadianBasqueBelgianBelizeanBermudanBhutaneseBlackfeetBolivianBrazilianBritishBritish West IndianBulgarianBurmeseCajunCambodianCanadianCape VerdeanCarpatho RusynCelticCentral AmericanCentral American IndianCherokeeCheyenneChickasawChileanChineseChippewaChoctawColombianColvilleComancheCosta RicanCreeCreekCroatianCrowCubanCypriotCzechCzechoslovakianDanishDelawareDominicanDutchDutch West IndianEastern EuropeanEcuadorianEgyptianEnglishEstonianEthiopianEuropeanFijianFilipinoFinnishFrenchFrench American IndianFrench CanadianGermanGerman RussianGhanaianGreekGuamanian/ChamorroGuatemalanGuyaneseHaitianHmongHonduranHopiHoumaHungarianIcelanderIndian (Asian)IndonesianInupiatIranianIraqiIrishIroquoisIsraeliItalianJamaicanJapaneseJordanianKenyanKiowaKoreanLaotianLatvianLebaneseLiberianLithuanianLumbeeLuxembourgerMacedonianMalaysianMalteseMarshalleseMenomineeMexicanMexican American IndianMongolianMoroccanNative HawaiianNavajoNepaleseNew ZealanderNicaraguanNigerianNorthern EuropeanNorwegianOkinawanOsageOttawaPaiutePakistaniPalestinianPanamanianParaguayanPennsylvania GermanPeruvianPimaPolishPortuguesePotawatomiPuebloPuerto RicanPuget Sound SalishRomanianRussianSalvadoranSamoanScandinavianScotch-IrishScottishSeminoleSenegaleseSerbianShoshoneSierra LeoneanSiouxSlavicSlovakSloveneSomaliSouth AfricanSouth AmericanSouth American IndianSoviet UnionSpaniardSpanishSpanish AmericanSpanish American IndianSri LankanSubsaharan AfricanSudaneseSwedishSwissSyrianTaiwaneseThaiTlingit-HaidaTohono O'OdhamTonganTrinidadian and TobagonianTsimshianTurkishU.S. Virgin IslanderUgandanUkrainianUruguayanUteVenezuelanVietnameseWelshWest IndianYakamaYaquiYugoslavianYumanYup'ikZimbabwean
Immigration
NonimmigrantsImmigrantsAfghanistanAfricaAlbaniaArgentinaArmeniaAsiaAustraliaAustriaBahamasBangladeshBarbadosBelarusBelgiumBelizeBoliviaBosnia and HerzegovinaBrazilBulgariaBurma/MyanmarCabo VerdeCambodiaCameroonCanadaCaribbeanCentral AmericaChileChinaColombiaCongoCosta RicaCroatiaCubaCzechoslovakiaDenmarkDominicaDominican RepublicEastern AfricaEastern AsiaEastern EuropeEcuadorEgyptEl SalvadorEnglandEritreaEthiopiaEuropeFijiFranceGermanyGhanaGreeceGrenadaGuatemalaGuyanaHaitiHondurasHong KongHungaryIndiaIndonesiaIranIraqIrelandIsraelItalyJamaicaJapanJordanKazakhstanKenyaKoreaKuwaitLaosLatin AmericaLatviaLebanonLiberiaLithuaniaMalaysiaMexicoMicronesiaMiddle AfricaMoldovaMoroccoNepalNetherlandsNicaraguaNigeriaNorth AmericaNorth MacedoniaNorthern AfricaNorthern EuropeNorwayOceaniaPakistanPanamaPeruPhilippinesPolandPortugalRomaniaRussiaSaudi ArabiaScotlandSenegalSerbiaSierra LeoneSingaporeSomaliaSouth AfricaSouth AmericaSouth Central AsiaSouth Eastern AsiaSouthern EuropeSpainSri LankaSt. Vincent and the GrenadinesSudanSwedenSwitzerlandSyriaTaiwanThailandTrinidad and TobagoTurkeyUgandaUkraineUruguayUzbekistanVenezuelaVietnamWest IndiesWestern AfricaWestern AsiaWestern EuropeYemenZaireZimbabweAzores
Select to Compare
Race
Ancestry
AfghanAfricanAlaska NativeAlaskan AthabascanAlbanianAleutAlsatianAmericanApacheArabArapahoArgentineanArmenianAssyrian/Chaldean/SyriacAustralianAustrianBahamianBangladeshiBarbadianBasqueBelgianBelizeanBermudanBhutaneseBlackfeetBolivianBrazilianBritishBritish West IndianBulgarianBurmeseCajunCambodianCanadianCape VerdeanCarpatho RusynCelticCentral AmericanCentral American IndianCherokeeCheyenneChickasawChileanChineseChippewaChoctawColombianColvilleComancheCosta RicanCreeCreekCroatianCrowCubanCypriotCzechCzechoslovakianDanishDelawareDominicanDutchDutch West IndianEastern EuropeanEcuadorianEgyptianEnglishEstonianEthiopianEuropeanFijianFilipinoFinnishFrenchFrench American IndianFrench CanadianGermanGerman RussianGhanaianGreekGuamanian/ChamorroGuatemalanGuyaneseHaitianHmongHonduranHopiHoumaHungarianIcelanderIndian (Asian)IndonesianInupiatIranianIraqiIrishIroquoisIsraeliItalianJamaicanJapaneseJordanianKenyanKiowaKoreanLaotianLatvianLebaneseLiberianLithuanianLumbeeLuxembourgerMacedonianMalaysianMalteseMarshalleseMenomineeMexicanMexican American IndianMongolianMoroccanNative HawaiianNavajoNepaleseNew ZealanderNicaraguanNorthern EuropeanNorwegianOkinawanOsageOttawaPaiutePakistaniPalestinianPanamanianParaguayanPennsylvania GermanPeruvianPimaPolishPortuguesePotawatomiPuebloPuerto RicanPuget Sound SalishRomanianRussianSalvadoranSamoanScandinavianScotch-IrishScottishSeminoleSenegaleseSerbianShoshoneSierra LeoneanSiouxSlavicSlovakSloveneSomaliSouth AfricanSouth AmericanSouth American IndianSoviet UnionSpaniardSpanishSpanish AmericanSpanish American IndianSri LankanSubsaharan AfricanSudaneseSwedishSwissSyrianTaiwaneseThaiTlingit-HaidaTohono O'OdhamTonganTrinidadian and TobagonianTsimshianTurkishU.S. Virgin IslanderUgandanUkrainianUruguayanUteVenezuelanVietnameseWelshWest IndianYakamaYaquiYugoslavianYumanYup'ikZimbabwean
Immigration
NonimmigrantsImmigrantsAfghanistanAfricaAlbaniaArgentinaArmeniaAsiaAustraliaAustriaBahamasBangladeshBarbadosBelarusBelgiumBelizeBoliviaBosnia and HerzegovinaBrazilBulgariaBurma/MyanmarCabo VerdeCambodiaCameroonCanadaCaribbeanCentral AmericaChileChinaColombiaCongoCosta RicaCroatiaCubaCzechoslovakiaDenmarkDominicaDominican RepublicEastern AfricaEastern AsiaEastern EuropeEcuadorEgyptEl SalvadorEnglandEritreaEthiopiaEuropeFijiFranceGermanyGhanaGreeceGrenadaGuatemalaGuyanaHaitiHondurasHong KongHungaryIndiaIndonesiaIranIraqIrelandIsraelItalyJamaicaJapanJordanKazakhstanKenyaKoreaKuwaitLaosLatin AmericaLatviaLebanonLiberiaLithuaniaMalaysiaMexicoMicronesiaMiddle AfricaMoldovaMoroccoNepalNetherlandsNicaraguaNigeriaNorth AmericaNorth MacedoniaNorthern AfricaNorthern EuropeNorwayOceaniaPakistanPanamaPeruPhilippinesPolandPortugalRomaniaRussiaSaudi ArabiaScotlandSenegalSerbiaSierra LeoneSingaporeSomaliaSouth AfricaSouth AmericaSouth Central AsiaSouth Eastern AsiaSouthern EuropeSpainSri LankaSt. Vincent and the GrenadinesSudanSwedenSwitzerlandSyriaTaiwanThailandTrinidad and TobagoTurkeyUgandaUkraineUruguayUzbekistanVenezuelaVietnamWest IndiesWestern AfricaWestern AsiaWestern EuropeYemenZaireZimbabweAzores
College, Under 1 year
Income
Poverty
Unemployment
Labor Participation
Family Structure
Vehicle Availability
Education Level
Disability

Nigerian College, Under 1 year
Poor

64.3%
COLLEGE, UNDER 1 YEAR
16.7/ 100
METRIC RATING
200th/ 347
METRIC RANK

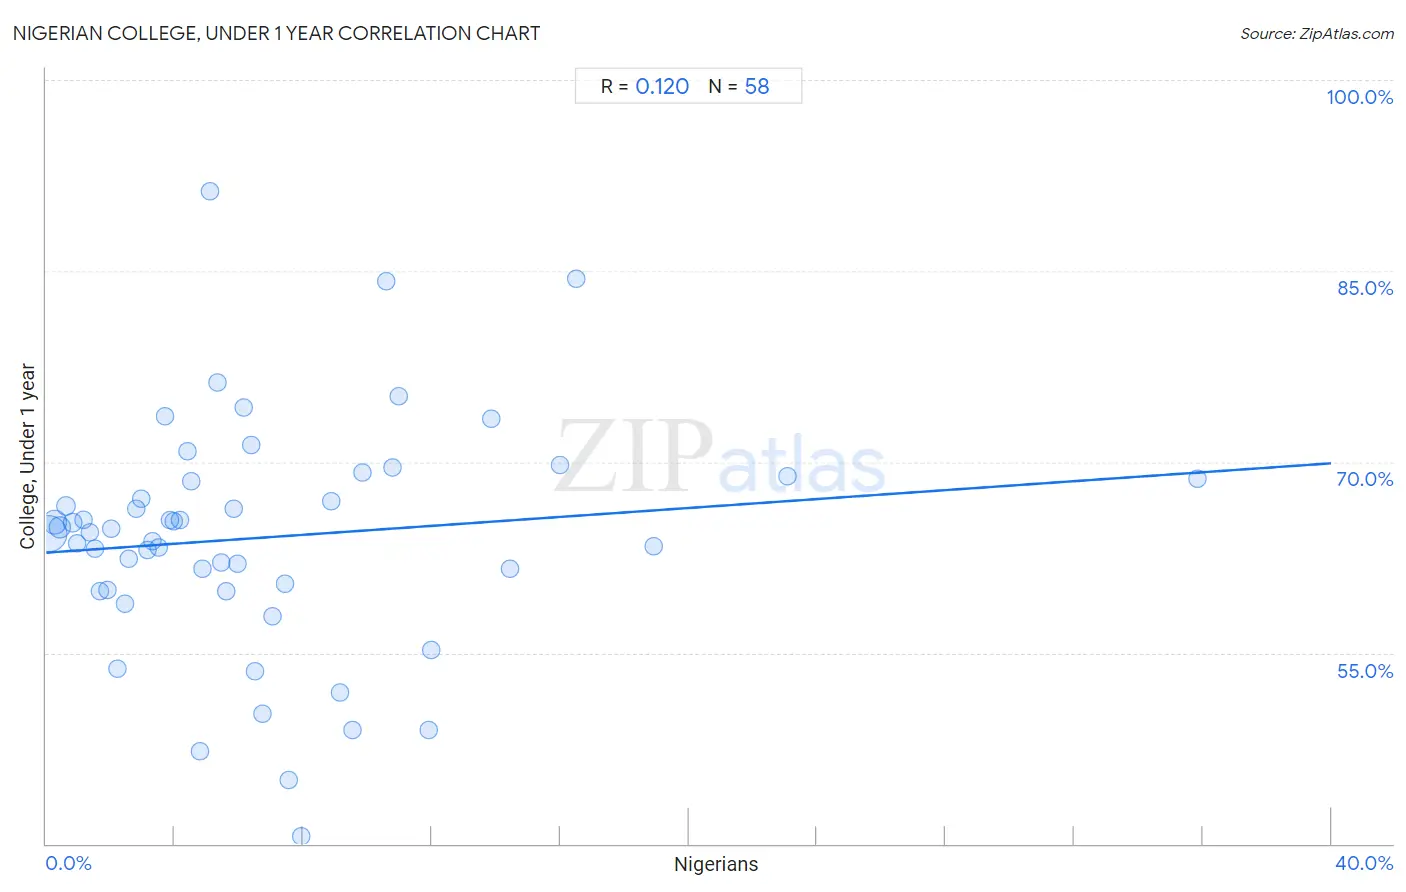
Nigerian College, Under 1 year Correlation Chart

The statistical analysis conducted on geographies consisting of 332,779,766 people shows a poor positive correlation between the proportion of Nigerians and percentage of population with at least college, under 1 year education in the United States with a correlation coefficient (R) of 0.120 and weighted average of 64.3%. On average, for every 1% (one percent) increase in Nigerians within a typical geography, there is an increase of 0.18% in percentage of population with at least college, under 1 year education.
Nigerian College, Under 1 year
It is essential to understand that the correlation between the percentage of Nigerians and percentage of population with at least college, under 1 year education does not imply a direct cause-and-effect relationship. It remains uncertain whether the presence of Nigerians influences an upward or downward trend in the level of percentage of population with at least college, under 1 year education within an area, or if Nigerians simply ended up residing in those areas with higher or lower levels of percentage of population with at least college, under 1 year education due to other factors.

Demographics Similar to Nigerians by College, Under 1 year

In terms of college, under 1 year, the demographic groups most similar to Nigerians are Panamanian (64.3%, a difference of 0.020%), French Canadian (64.2%, a difference of 0.040%), South American (64.2%, a difference of 0.040%), Tsimshian (64.3%, a difference of 0.090%), and Uruguayan (64.2%, a difference of 0.090%).
DemographicsRating | RankCollege, Under 1 year
Slovaks
26.7
/100
|
#193
Fair
64.7%
Immigrants from Cameroon
24.6
/100
|
#194
Fair
64.6%
Immigrants from South Eastern Asia
22.1
/100
|
#195
Fair
64.5%
Tongans
21.2
/100
|
#196
Fair
64.5%
Costa Ricans
19.6
/100
|
#197
Poor
64.4%
Tsimshian
17.9
/100
|
#198
Poor
64.3%
Panamanians
17.0
/100
|
#199
Poor
64.3%
Nigerians
16.7
/100
|
#200
Poor
64.3%
French Canadians
16.3
/100
|
#201
Poor
64.2%
South Americans
16.2
/100
|
#202
Poor
64.2%
Uruguayans
15.6
/100
|
#203
Poor
64.2%
Immigrants from Zaire
14.6
/100
|
#204
Poor
64.1%
Peruvians
13.7
/100
|
#205
Poor
64.1%
Whites/Caucasians
12.8
/100
|
#206
Poor
64.0%
Colombians
12.4
/100
|
#207
Poor
64.0%

Nigerian College, Under 1 year Correlation Summary

MeasurementNigerian DataCollege, Under 1 year Data
Minimum0.080%40.6%
Maximum35.8%91.3%
Range35.7%50.7%
Mean6.7%64.0%
Median5.2%64.6%
Interquartile 25% (IQ1)2.6%59.9%
Interquartile 75% (IQ3)9.1%68.7%
Interquartile Range (IQR)6.6%8.8%
Standard Deviation (Sample)6.3%9.2%
Standard Deviation (Population)6.2%9.2%

Correlation Details

Nigerian PercentileSample SizeCollege, Under 1 year
[
0.0%
-
0.5%
]
0.080%
178,273,86764.3%
[
0.0%
-
0.5%
]
0.25%
65,735,02965.3%
[
0.0%
-
0.5%
]
0.42%
38,816,74764.9%
[
0.5%
-
1.0%
]
0.61%
17,230,22066.6%
[
0.5%
-
1.0%
]
0.81%
9,203,03765.3%
[
0.5%
-
1.0%
]
0.96%
7,784,30063.6%
[
1.0%
-
1.5%
]
1.17%
3,809,48165.4%
[
1.0%
-
1.5%
]
1.34%
2,893,30864.5%
[
1.5%
-
2.0%
]
1.53%
1,314,75363.2%
[
1.5%
-
2.0%
]
1.69%
1,324,55959.9%
[
1.5%
-
2.0%
]
1.90%
830,17159.9%
[
2.0%
-
2.5%
]
2.04%
811,14664.7%
[
2.0%
-
2.5%
]
2.22%
802,07953.7%
[
2.0%
-
2.5%
]
2.43%
615,81658.8%
[
2.5%
-
3.0%
]
2.59%
328,63062.4%
[
2.5%
-
3.0%
]
2.79%
201,51766.4%
[
2.5%
-
3.0%
]
2.95%
299,07667.1%
[
3.0%
-
3.5%
]
3.14%
220,51763.1%
[
3.0%
-
3.5%
]
3.32%
194,17363.7%
[
3.0%
-
3.5%
]
3.49%
207,48063.3%
[
3.5%
-
4.0%
]
3.68%
141,65273.6%
[
3.5%
-
4.0%
]
3.86%
81,44565.5%
[
3.5%
-
4.0%
]
3.98%
188,55165.3%
[
4.0%
-
4.5%
]
4.18%
205,78665.5%
[
4.0%
-
4.5%
]
4.41%
68,59970.8%
[
4.5%
-
5.0%
]
4.51%
96,40868.4%
[
4.5%
-
5.0%
]
4.79%
92,12447.2%
[
4.5%
-
5.0%
]
4.88%
182,48261.6%
[
5.0%
-
5.5%
]
5.08%
1,57591.3%
[
5.0%
-
5.5%
]
5.31%
43,68676.2%
[
5.0%
-
5.5%
]
5.44%
97,10062.1%
[
5.5%
-
6.0%
]
5.60%
112,27659.8%
[
5.5%
-
6.0%
]
5.82%
70,07866.3%
[
5.5%
-
6.0%
]
5.95%
70,19762.0%
[
6.0%
-
6.5%
]
6.15%
26,14174.3%
[
6.0%
-
6.5%
]
6.37%
8,20571.3%
[
6.5%
-
7.0%
]
6.51%
123,13553.5%
[
6.5%
-
7.0%
]
6.75%
47,96750.2%
[
7.0%
-
7.5%
]
7.06%
1,31757.9%
[
7.0%
-
7.5%
]
7.42%
82260.4%
[
7.5%
-
8.0%
]
7.56%
55,87645.0%
[
7.5%
-
8.0%
]
7.95%
66740.6%
[
8.5%
-
9.0%
]
8.88%
116,58766.9%
[
9.0%
-
9.5%
]
9.15%
2,35151.8%
[
9.5%
-
10.0%
]
9.54%
12,48748.9%
[
9.5%
-
10.0%
]
9.83%
2,29969.1%
[
10.5%
-
11.0%
]
10.58%
4,37584.2%
[
10.5%
-
11.0%
]
10.78%
1,38269.5%
[
10.5%
-
11.0%
]
10.97%
1,03075.2%
[
11.5%
-
12.0%
]
11.89%
14349.0%
[
12.0%
-
12.5%
]
12.00%
1,87555.2%
[
13.5%
-
14.0%
]
13.85%
13,19273.4%
[
14.0%
-
14.5%
]
14.44%
2,34861.6%
[
15.5%
-
16.0%
]
15.99%
3,91469.7%
[
16.0%
-
16.5%
]
16.48%
18284.3%
[
18.5%
-
19.0%
]
18.91%
5,33163.4%
[
23.0%
-
23.5%
]
23.08%
20868.9%
[
35.5%
-
36.0%
]
35.82%
6768.7%