Nigerian Unemployment Among Women with Children Ages 6 to 17 years
COMPARE
Nigerian
Select to Compare
Unemployment Among Women with Children Ages 6 to 17 years
Nigerian Unemployment Among Women with Children Ages 6 to 17 years
10.1%
UNEMPLOYMENT | WOMEN W/ CHILDREN 6 TO 17
0.0/ 100
METRIC RATING
300th/ 347
METRIC RANK
Nigerian Unemployment Among Women with Children Ages 6 to 17 years Correlation Chart
The statistical analysis conducted on geographies consisting of 257,309,960 people shows a mild positive correlation between the proportion of Nigerians and unemployment rate among women with children between the ages 6 and 17 in the United States with a correlation coefficient (R) of 0.376 and weighted average of 10.1%. On average, for every 1% (one percent) increase in Nigerians within a typical geography, there is an increase of 1.4% in unemployment rate among women with children between the ages 6 and 17.
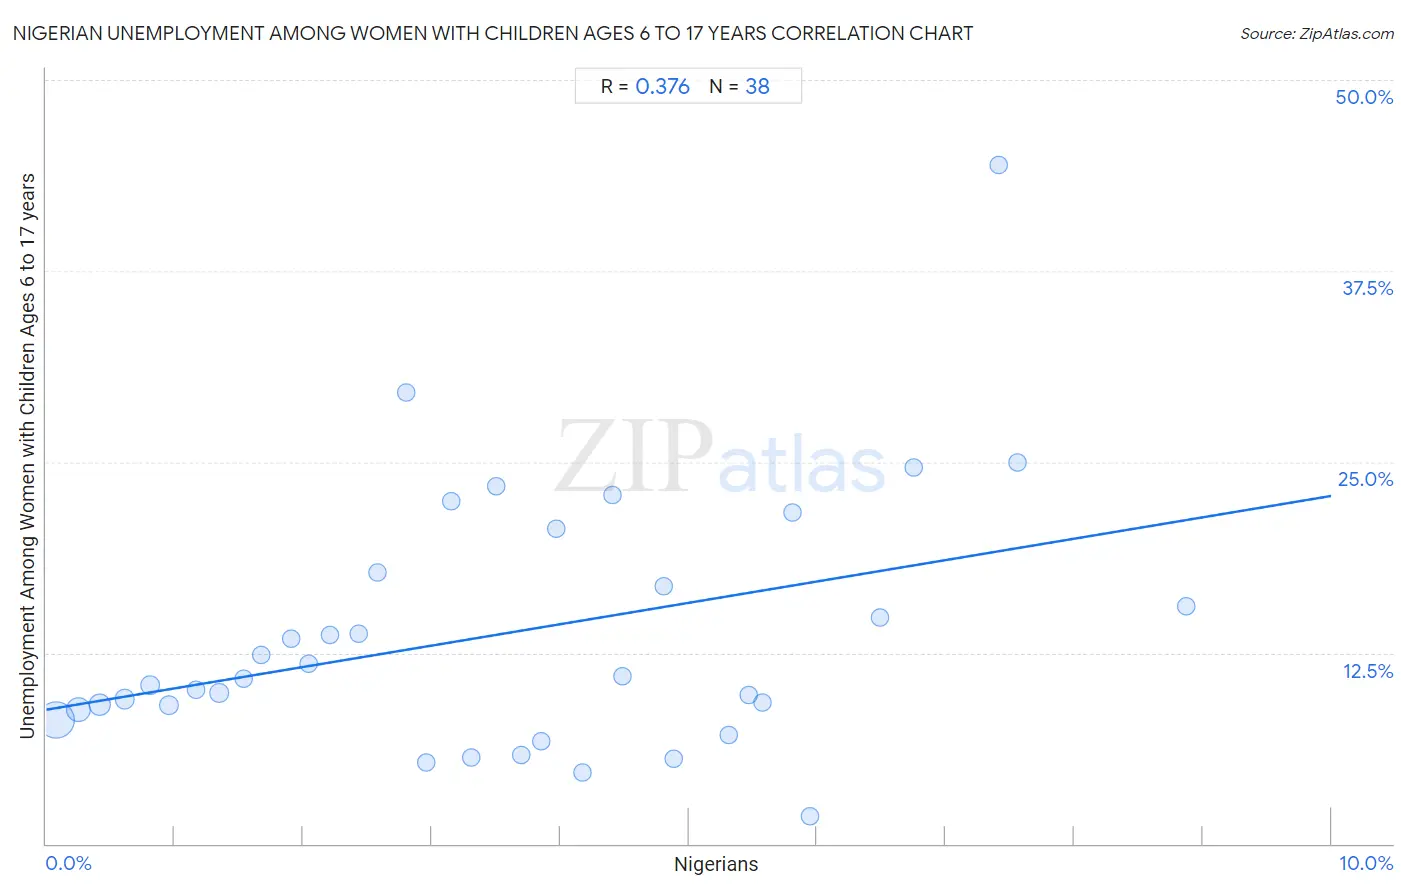
It is essential to understand that the correlation between the percentage of Nigerians and unemployment rate among women with children between the ages 6 and 17 does not imply a direct cause-and-effect relationship. It remains uncertain whether the presence of Nigerians influences an upward or downward trend in the level of unemployment rate among women with children between the ages 6 and 17 within an area, or if Nigerians simply ended up residing in those areas with higher or lower levels of unemployment rate among women with children between the ages 6 and 17 due to other factors.
Demographics Similar to Nigerians by Unemployment Among Women with Children Ages 6 to 17 years
In terms of unemployment among women with children ages 6 to 17 years, the demographic groups most similar to Nigerians are Immigrants from Honduras (10.1%, a difference of 0.020%), Immigrants from Haiti (10.1%, a difference of 0.040%), Immigrants from Bahamas (10.1%, a difference of 0.15%), Immigrants from Caribbean (10.1%, a difference of 0.34%), and Immigrants from Western Africa (10.1%, a difference of 0.36%).
| Demographics | Rating | Rank | Unemployment Among Women with Children Ages 6 to 17 years |
| Haitians | 0.0 /100 | #293 | Tragic 10.0% |
| Ecuadorians | 0.0 /100 | #294 | Tragic 10.0% |
| Cherokee | 0.0 /100 | #295 | Tragic 10.0% |
| Immigrants from Western Africa | 0.0 /100 | #296 | Tragic 10.1% |
| Immigrants from Caribbean | 0.0 /100 | #297 | Tragic 10.1% |
| Immigrants from Haiti | 0.0 /100 | #298 | Tragic 10.1% |
| Immigrants from Honduras | 0.0 /100 | #299 | Tragic 10.1% |
| Nigerians | 0.0 /100 | #300 | Tragic 10.1% |
| Immigrants from Bahamas | 0.0 /100 | #301 | Tragic 10.1% |
| Venezuelans | 0.0 /100 | #302 | Tragic 10.2% |
| Immigrants from Ecuador | 0.0 /100 | #303 | Tragic 10.2% |
| Immigrants from Venezuela | 0.0 /100 | #304 | Tragic 10.2% |
| Immigrants from Nigeria | 0.0 /100 | #305 | Tragic 10.2% |
| Paraguayans | 0.0 /100 | #306 | Tragic 10.2% |
| Immigrants from Senegal | 0.0 /100 | #307 | Tragic 10.2% |
Nigerian Unemployment Among Women with Children Ages 6 to 17 years Correlation Summary
| Measurement | Nigerian Data | Unemployment Among Women with Children Ages 6 to 17 years Data |
| Minimum | 0.081% | 1.8% |
| Maximum | 8.9% | 44.4% |
| Range | 8.8% | 42.6% |
| Mean | 3.6% | 13.8% |
| Median | 3.4% | 10.9% |
| Interquartile 25% (IQ1) | 1.7% | 8.8% |
| Interquartile 75% (IQ3) | 5.3% | 17.8% |
| Interquartile Range (IQR) | 3.6% | 9.0% |
| Standard Deviation (Sample) | 2.3% | 8.4% |
| Standard Deviation (Population) | 2.2% | 8.3% |
Correlation Details
| Nigerian Percentile | Sample Size | Unemployment Among Women with Children Ages 6 to 17 years |
[ 0.0% - 0.5% ] 0.081% | 137,029,193 | 8.1% |
[ 0.0% - 0.5% ] 0.25% | 50,865,694 | 8.8% |
[ 0.0% - 0.5% ] 0.42% | 31,616,817 | 9.1% |
[ 0.5% - 1.0% ] 0.61% | 12,997,290 | 9.5% |
[ 0.5% - 1.0% ] 0.81% | 6,775,386 | 10.4% |
[ 0.5% - 1.0% ] 0.96% | 6,228,202 | 9.1% |
[ 1.0% - 1.5% ] 1.16% | 2,868,325 | 10.1% |
[ 1.0% - 1.5% ] 1.35% | 2,438,666 | 9.9% |
[ 1.5% - 2.0% ] 1.53% | 924,513 | 10.8% |
[ 1.5% - 2.0% ] 1.68% | 827,796 | 12.4% |
[ 1.5% - 2.0% ] 1.91% | 582,454 | 13.4% |
[ 2.0% - 2.5% ] 2.04% | 520,127 | 11.8% |
[ 2.0% - 2.5% ] 2.21% | 609,733 | 13.6% |
[ 2.0% - 2.5% ] 2.43% | 522,219 | 13.8% |
[ 2.5% - 3.0% ] 2.58% | 274,557 | 17.8% |
[ 2.5% - 3.0% ] 2.80% | 82,295 | 29.5% |
[ 2.5% - 3.0% ] 2.96% | 254,109 | 5.3% |
[ 3.0% - 3.5% ] 3.15% | 184,160 | 22.4% |
[ 3.0% - 3.5% ] 3.31% | 129,725 | 5.6% |
[ 3.5% - 4.0% ] 3.50% | 151,493 | 23.4% |
[ 3.5% - 4.0% ] 3.69% | 103,588 | 5.8% |
[ 3.5% - 4.0% ] 3.85% | 51,876 | 6.7% |
[ 3.5% - 4.0% ] 3.97% | 167,673 | 20.6% |
[ 4.0% - 4.5% ] 4.18% | 196,430 | 4.7% |
[ 4.0% - 4.5% ] 4.41% | 63,816 | 22.8% |
[ 4.0% - 4.5% ] 4.49% | 54,402 | 11.0% |
[ 4.5% - 5.0% ] 4.81% | 77,191 | 16.8% |
[ 4.5% - 5.0% ] 4.88% | 112,341 | 5.6% |
[ 5.0% - 5.5% ] 5.31% | 30,785 | 7.1% |
[ 5.0% - 5.5% ] 5.47% | 44,614 | 9.8% |
[ 5.5% - 6.0% ] 5.58% | 86,787 | 9.2% |
[ 5.5% - 6.0% ] 5.80% | 57,579 | 21.7% |
[ 5.5% - 6.0% ] 5.94% | 53,401 | 1.8% |
[ 6.0% - 6.5% ] 6.49% | 107,195 | 14.8% |
[ 6.5% - 7.0% ] 6.75% | 46,822 | 24.7% |
[ 7.0% - 7.5% ] 7.41% | 526 | 44.4% |
[ 7.5% - 8.0% ] 7.56% | 55,876 | 25.0% |
[ 8.5% - 9.0% ] 8.88% | 116,304 | 15.5% |