Lumbee GED/Equivalency
COMPARE
Lumbee
Select to Compare
GED/Equivalency
Lumbee GED/Equivalency
80.0%
GED/EQUIVALENCY
0.0/ 100
METRIC RATING
322nd/ 347
METRIC RANK
Lumbee GED/Equivalency Correlation Chart
The statistical analysis conducted on geographies consisting of 92,299,068 people shows no correlation between the proportion of Lumbee and percentage of population with at least ged/equivalency education in the United States with a correlation coefficient (R) of -0.018 and weighted average of 80.0%. On average, for every 1% (one percent) increase in Lumbee within a typical geography, there is a decrease of 0.0082% in percentage of population with at least ged/equivalency education.
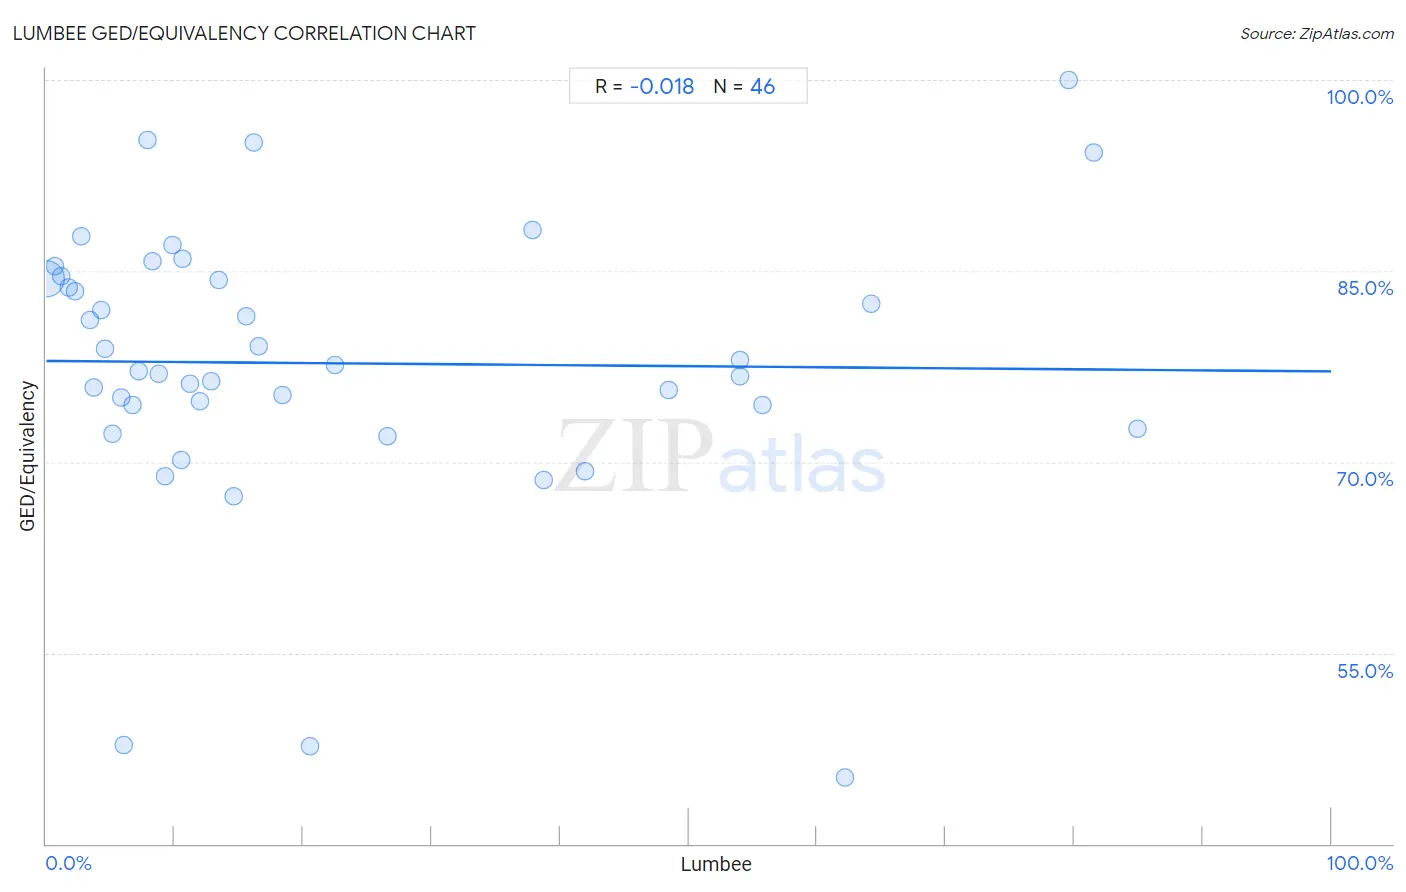
It is essential to understand that the correlation between the percentage of Lumbee and percentage of population with at least ged/equivalency education does not imply a direct cause-and-effect relationship. It remains uncertain whether the presence of Lumbee influences an upward or downward trend in the level of percentage of population with at least ged/equivalency education within an area, or if Lumbee simply ended up residing in those areas with higher or lower levels of percentage of population with at least ged/equivalency education due to other factors.
Demographics Similar to Lumbee by GED/Equivalency
In terms of ged/equivalency, the demographic groups most similar to Lumbee are Yup'ik (80.0%, a difference of 0.070%), Immigrants from Nicaragua (79.9%, a difference of 0.12%), Immigrants from Cuba (80.2%, a difference of 0.24%), Yaqui (80.5%, a difference of 0.65%), and Immigrants from Belize (80.5%, a difference of 0.65%).
| Demographics | Rating | Rank | GED/Equivalency |
| Apache | 0.0 /100 | #315 | Tragic 80.7% |
| Central American Indians | 0.0 /100 | #316 | Tragic 80.6% |
| Immigrants from Caribbean | 0.0 /100 | #317 | Tragic 80.5% |
| Yaqui | 0.0 /100 | #318 | Tragic 80.5% |
| Immigrants from Belize | 0.0 /100 | #319 | Tragic 80.5% |
| Immigrants from Cuba | 0.0 /100 | #320 | Tragic 80.2% |
| Yup'ik | 0.0 /100 | #321 | Tragic 80.0% |
| Lumbee | 0.0 /100 | #322 | Tragic 80.0% |
| Immigrants from Nicaragua | 0.0 /100 | #323 | Tragic 79.9% |
| Mexican American Indians | 0.0 /100 | #324 | Tragic 79.4% |
| Hondurans | 0.0 /100 | #325 | Tragic 79.3% |
| Yuman | 0.0 /100 | #326 | Tragic 79.2% |
| Central Americans | 0.0 /100 | #327 | Tragic 79.2% |
| Hispanics or Latinos | 0.0 /100 | #328 | Tragic 79.1% |
| Dominicans | 0.0 /100 | #329 | Tragic 79.1% |
Lumbee GED/Equivalency Correlation Summary
| Measurement | Lumbee Data | GED/Equivalency Data |
| Minimum | 0.041% | 45.2% |
| Maximum | 84.9% | 100.0% |
| Range | 84.9% | 54.8% |
| Mean | 22.3% | 77.7% |
| Median | 11.6% | 77.4% |
| Interquartile 25% (IQ1) | 5.9% | 74.5% |
| Interquartile 75% (IQ3) | 37.8% | 84.4% |
| Interquartile Range (IQR) | 32.0% | 10.0% |
| Standard Deviation (Sample) | 24.0% | 11.1% |
| Standard Deviation (Population) | 23.7% | 11.0% |
Correlation Details
| Lumbee Percentile | Sample Size | GED/Equivalency |
[ 0.0% - 0.5% ] 0.041% | 90,482,511 | 84.4% |
[ 0.5% - 1.0% ] 0.65% | 1,119,807 | 85.4% |
[ 1.0% - 1.5% ] 1.20% | 223,864 | 84.6% |
[ 1.5% - 2.0% ] 1.79% | 120,266 | 83.7% |
[ 2.0% - 2.5% ] 2.25% | 82,084 | 83.4% |
[ 2.5% - 3.0% ] 2.71% | 10,026 | 87.7% |
[ 3.0% - 3.5% ] 3.43% | 9,255 | 81.1% |
[ 3.5% - 4.0% ] 3.68% | 9,759 | 75.8% |
[ 4.0% - 4.5% ] 4.27% | 5,527 | 81.9% |
[ 4.5% - 5.0% ] 4.61% | 8,847 | 78.9% |
[ 5.0% - 5.5% ] 5.11% | 6,276 | 72.2% |
[ 5.5% - 6.0% ] 5.88% | 391 | 75.1% |
[ 6.0% - 6.5% ] 6.05% | 2,016 | 47.8% |
[ 6.5% - 7.0% ] 6.70% | 1,418 | 74.5% |
[ 7.0% - 7.5% ] 7.24% | 18,893 | 77.1% |
[ 7.5% - 8.0% ] 7.83% | 1,417 | 95.3% |
[ 8.0% - 8.5% ] 8.27% | 1,548 | 85.8% |
[ 8.5% - 9.0% ] 8.72% | 3,177 | 76.9% |
[ 9.0% - 9.5% ] 9.22% | 965 | 68.9% |
[ 9.5% - 10.0% ] 9.82% | 906 | 87.0% |
[ 10.0% - 10.5% ] 10.47% | 10,588 | 70.2% |
[ 10.5% - 11.0% ] 10.57% | 946 | 85.9% |
[ 11.0% - 11.5% ] 11.24% | 27,494 | 76.2% |
[ 11.5% - 12.0% ] 11.95% | 25,783 | 74.8% |
[ 12.5% - 13.0% ] 12.84% | 4,385 | 76.3% |
[ 13.0% - 13.5% ] 13.47% | 2,272 | 84.3% |
[ 14.5% - 15.0% ] 14.61% | 869 | 67.3% |
[ 15.5% - 16.0% ] 15.52% | 2,519 | 81.5% |
[ 16.0% - 16.5% ] 16.12% | 769 | 95.1% |
[ 16.5% - 17.0% ] 16.58% | 34,093 | 79.1% |
[ 18.0% - 18.5% ] 18.38% | 3,118 | 75.2% |
[ 20.5% - 21.0% ] 20.57% | 316 | 47.7% |
[ 22.0% - 22.5% ] 22.45% | 245 | 77.6% |
[ 26.5% - 27.0% ] 26.53% | 9,790 | 72.0% |
[ 37.5% - 38.0% ] 37.84% | 37 | 88.2% |
[ 38.5% - 39.0% ] 38.67% | 11,548 | 68.6% |
[ 41.5% - 42.0% ] 41.93% | 5,065 | 69.3% |
[ 48.0% - 48.5% ] 48.45% | 97 | 75.6% |
[ 54.0% - 54.5% ] 54.00% | 300 | 78.0% |
[ 54.0% - 54.5% ] 54.01% | 6,499 | 76.7% |
[ 55.5% - 56.0% ] 55.71% | 29,670 | 74.5% |
[ 62.0% - 62.5% ] 62.12% | 264 | 45.2% |
[ 64.0% - 64.5% ] 64.19% | 12,346 | 82.4% |
[ 79.5% - 80.0% ] 79.59% | 147 | 100.0% |
[ 81.5% - 82.0% ] 81.54% | 650 | 94.3% |
[ 84.5% - 85.0% ] 84.92% | 305 | 72.6% |