Lumbee Self-Care Disability
COMPARE
Lumbee
Select to Compare
Self-Care Disability
Lumbee Self-Care Disability
3.0%
SELF-CARE DISABILITY
0.0/ 100
METRIC RATING
331st/ 347
METRIC RANK
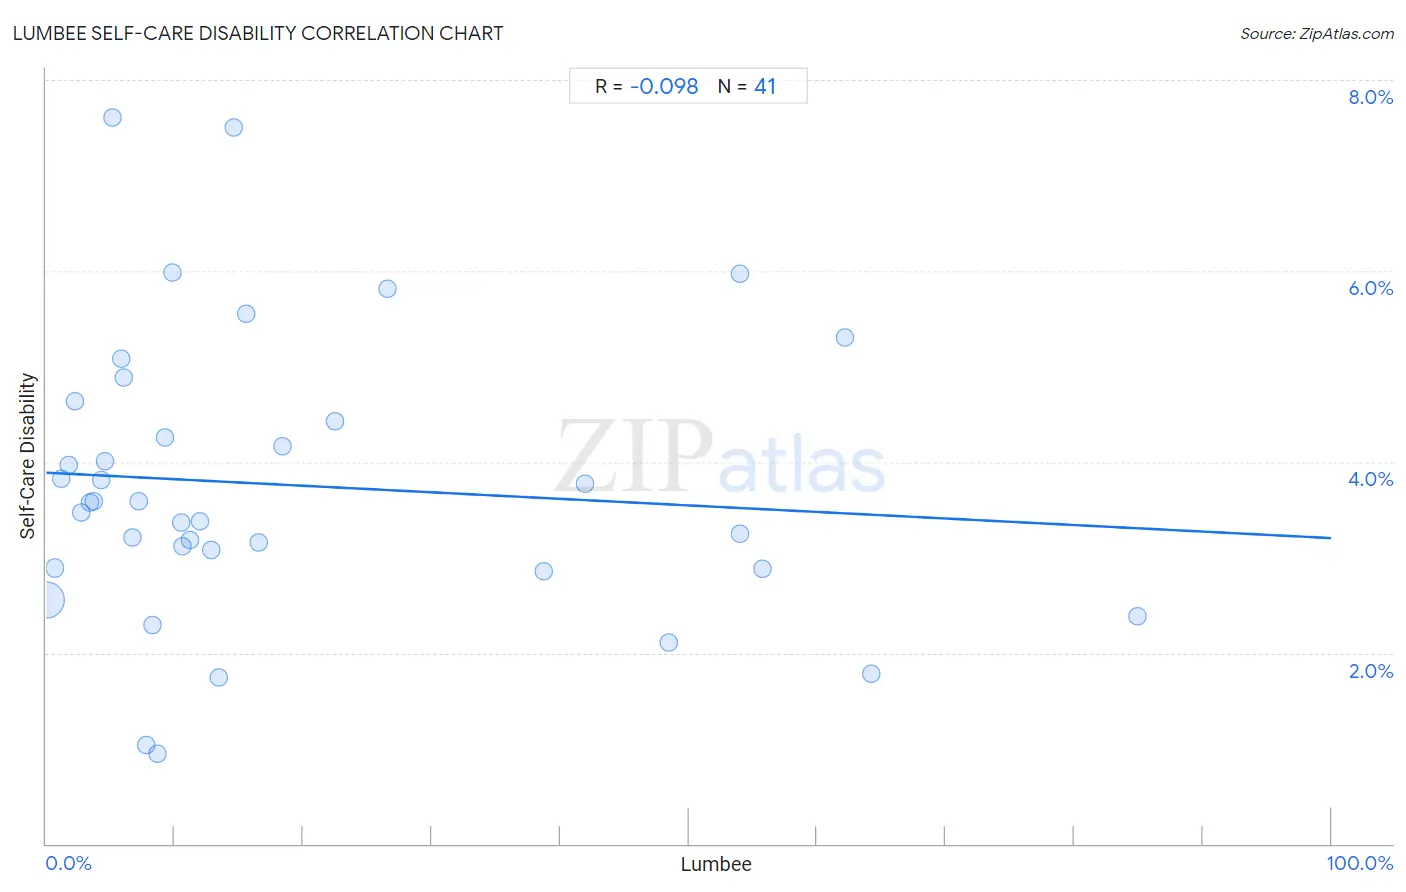
Lumbee Self-Care Disability Correlation Chart
The statistical analysis conducted on geographies consisting of 92,217,287 people shows a slight negative correlation between the proportion of Lumbee and percentage of population with self-care disability in the United States with a correlation coefficient (R) of -0.098 and weighted average of 3.0%. On average, for every 1% (one percent) increase in Lumbee within a typical geography, there is a decrease of 0.0069% in percentage of population with self-care disability.
It is essential to understand that the correlation between the percentage of Lumbee and percentage of population with self-care disability does not imply a direct cause-and-effect relationship. It remains uncertain whether the presence of Lumbee influences an upward or downward trend in the level of percentage of population with self-care disability within an area, or if Lumbee simply ended up residing in those areas with higher or lower levels of percentage of population with self-care disability due to other factors.
Demographics Similar to Lumbee by Self-Care Disability
In terms of self-care disability, the demographic groups most similar to Lumbee are Nepalese (3.0%, a difference of 0.12%), Kiowa (3.0%, a difference of 0.36%), Dutch West Indian (3.0%, a difference of 0.59%), Houma (3.0%, a difference of 0.66%), and Immigrants from the Azores (3.0%, a difference of 0.71%).
| Demographics | Rating | Rank | Self-Care Disability |
| Cherokee | 0.0 /100 | #324 | Tragic 2.9% |
| Immigrants from Uzbekistan | 0.0 /100 | #325 | Tragic 2.9% |
| Paiute | 0.0 /100 | #326 | Tragic 2.9% |
| Blacks/African Americans | 0.0 /100 | #327 | Tragic 2.9% |
| Hopi | 0.0 /100 | #328 | Tragic 2.9% |
| Cajuns | 0.0 /100 | #329 | Tragic 2.9% |
| Nepalese | 0.0 /100 | #330 | Tragic 3.0% |
| Lumbee | 0.0 /100 | #331 | Tragic 3.0% |
| Kiowa | 0.0 /100 | #332 | Tragic 3.0% |
| Dutch West Indians | 0.0 /100 | #333 | Tragic 3.0% |
| Houma | 0.0 /100 | #334 | Tragic 3.0% |
| Immigrants from the Azores | 0.0 /100 | #335 | Tragic 3.0% |
| Immigrants from Yemen | 0.0 /100 | #336 | Tragic 3.0% |
| Choctaw | 0.0 /100 | #337 | Tragic 3.0% |
| Cape Verdeans | 0.0 /100 | #338 | Tragic 3.0% |
Lumbee Self-Care Disability Correlation Summary
| Measurement | Lumbee Data | Self-Care Disability Data |
| Minimum | 0.041% | 0.94% |
| Maximum | 84.9% | 7.6% |
| Range | 84.9% | 6.7% |
| Mean | 19.2% | 3.8% |
| Median | 10.5% | 3.6% |
| Interquartile 25% (IQ1) | 4.9% | 2.9% |
| Interquartile 75% (IQ3) | 24.5% | 4.5% |
| Interquartile Range (IQR) | 19.6% | 1.6% |
| Standard Deviation (Sample) | 21.4% | 1.5% |
| Standard Deviation (Population) | 21.2% | 1.5% |
Correlation Details
| Lumbee Percentile | Sample Size | Self-Care Disability |
[ 0.0% - 0.5% ] 0.041% | 90,415,533 | 2.6% |
[ 0.5% - 1.0% ] 0.65% | 1,114,908 | 2.9% |
[ 1.0% - 1.5% ] 1.20% | 220,634 | 3.8% |
[ 1.5% - 2.0% ] 1.79% | 119,106 | 4.0% |
[ 2.0% - 2.5% ] 2.25% | 81,297 | 4.6% |
[ 2.5% - 3.0% ] 2.71% | 10,026 | 3.5% |
[ 3.0% - 3.5% ] 3.43% | 9,255 | 3.6% |
[ 3.5% - 4.0% ] 3.68% | 9,759 | 3.6% |
[ 4.0% - 4.5% ] 4.25% | 4,777 | 3.8% |
[ 4.5% - 5.0% ] 4.61% | 8,847 | 4.0% |
[ 5.0% - 5.5% ] 5.11% | 6,276 | 7.6% |
[ 5.5% - 6.0% ] 5.88% | 391 | 5.1% |
[ 6.0% - 6.5% ] 6.05% | 2,016 | 4.9% |
[ 6.5% - 7.0% ] 6.70% | 1,418 | 3.2% |
[ 7.0% - 7.5% ] 7.24% | 18,893 | 3.6% |
[ 7.5% - 8.0% ] 7.81% | 679 | 1.0% |
[ 8.0% - 8.5% ] 8.27% | 1,548 | 2.3% |
[ 8.5% - 9.0% ] 8.62% | 1,857 | 0.94% |
[ 9.0% - 9.5% ] 9.22% | 965 | 4.3% |
[ 9.5% - 10.0% ] 9.82% | 906 | 6.0% |
[ 10.0% - 10.5% ] 10.47% | 10,588 | 3.4% |
[ 10.5% - 11.0% ] 10.57% | 946 | 3.1% |
[ 11.0% - 11.5% ] 11.24% | 27,494 | 3.2% |
[ 11.5% - 12.0% ] 11.95% | 25,783 | 3.4% |
[ 12.5% - 13.0% ] 12.84% | 4,385 | 3.1% |
[ 13.0% - 13.5% ] 13.47% | 2,272 | 1.7% |
[ 14.5% - 15.0% ] 14.61% | 869 | 7.5% |
[ 15.5% - 16.0% ] 15.52% | 2,519 | 5.5% |
[ 16.5% - 17.0% ] 16.58% | 34,093 | 3.2% |
[ 18.0% - 18.5% ] 18.38% | 3,118 | 4.2% |
[ 22.0% - 22.5% ] 22.45% | 245 | 4.4% |
[ 26.5% - 27.0% ] 26.53% | 9,790 | 5.8% |
[ 38.5% - 39.0% ] 38.67% | 11,548 | 2.9% |
[ 41.5% - 42.0% ] 41.93% | 5,065 | 3.8% |
[ 48.0% - 48.5% ] 48.45% | 97 | 2.1% |
[ 54.0% - 54.5% ] 54.00% | 300 | 6.0% |
[ 54.0% - 54.5% ] 54.01% | 6,499 | 3.2% |
[ 55.5% - 56.0% ] 55.71% | 29,670 | 2.9% |
[ 62.0% - 62.5% ] 62.12% | 264 | 5.3% |
[ 64.0% - 64.5% ] 64.19% | 12,346 | 1.8% |
[ 84.5% - 85.0% ] 84.92% | 305 | 2.4% |