Lumbee Married-couple Households
COMPARE
Lumbee
Select to Compare
Married-couple Households
Lumbee Married-couple Households
39.6%
MARRIED-COUPLE HOUSEHOLDS
0.0/ 100
METRIC RATING
327th/ 347
METRIC RANK
Lumbee Married-couple Households Correlation Chart
The statistical analysis conducted on geographies consisting of 92,264,260 people shows no correlation between the proportion of Lumbee and percentage of married-couple family households in the United States with a correlation coefficient (R) of -0.006 and weighted average of 39.6%. On average, for every 1% (one percent) increase in Lumbee within a typical geography, there is a decrease of 0.0020% in percentage of married-couple family households.
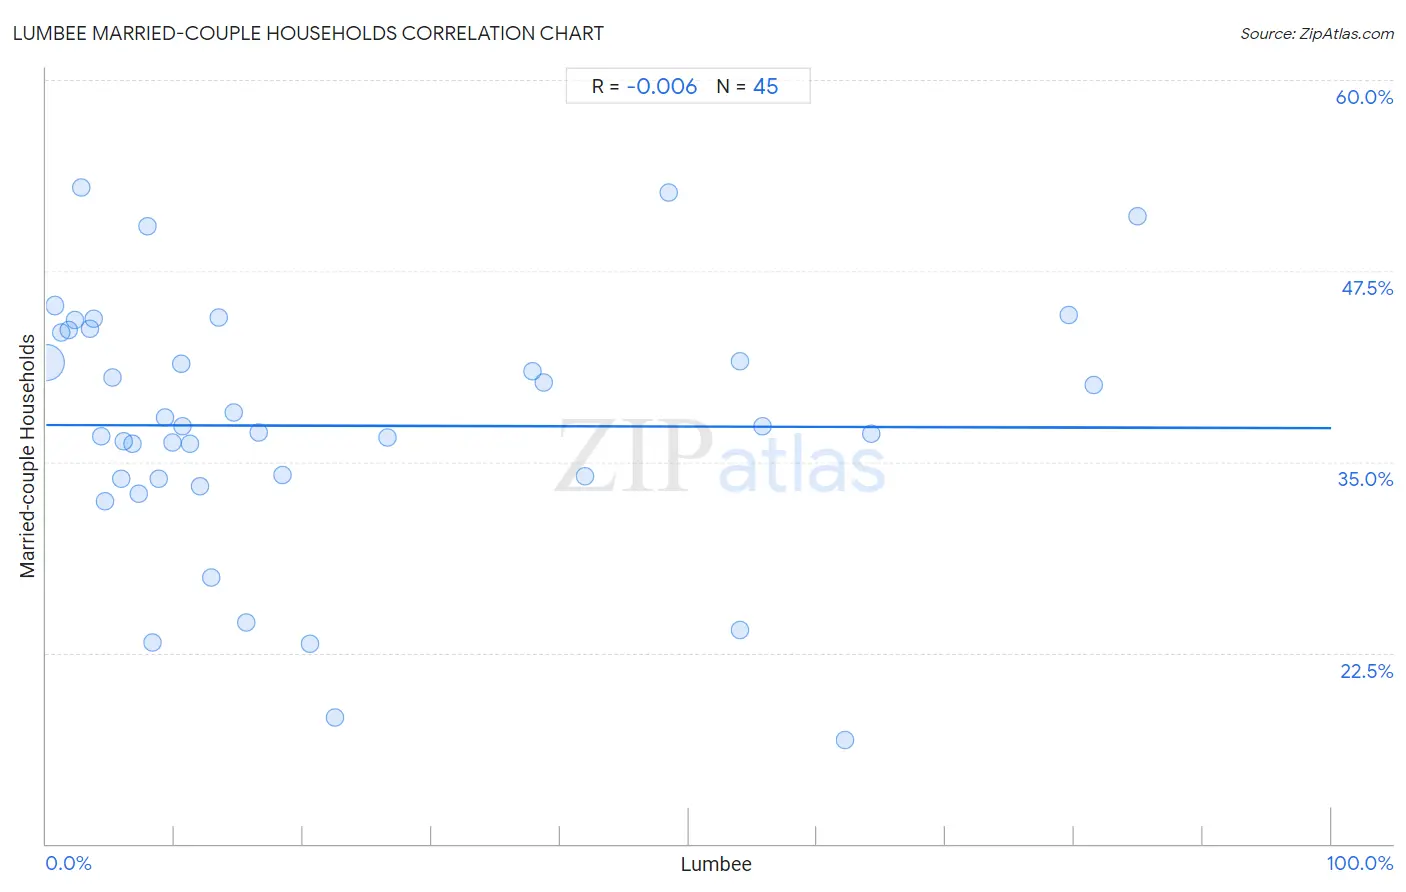
It is essential to understand that the correlation between the percentage of Lumbee and percentage of married-couple family households does not imply a direct cause-and-effect relationship. It remains uncertain whether the presence of Lumbee influences an upward or downward trend in the level of percentage of married-couple family households within an area, or if Lumbee simply ended up residing in those areas with higher or lower levels of percentage of married-couple family households due to other factors.
Demographics Similar to Lumbee by Married-couple Households
In terms of married-couple households, the demographic groups most similar to Lumbee are U.S. Virgin Islander (39.8%, a difference of 0.47%), Barbadian (39.4%, a difference of 0.50%), Immigrants from Dominica (39.4%, a difference of 0.57%), Pueblo (40.0%, a difference of 0.93%), and Immigrants from Barbados (39.2%, a difference of 1.0%).
| Demographics | Rating | Rank | Married-couple Households |
| West Indians | 0.0 /100 | #320 | Tragic 40.3% |
| Immigrants from Liberia | 0.0 /100 | #321 | Tragic 40.3% |
| Immigrants from Zaire | 0.0 /100 | #322 | Tragic 40.1% |
| Puerto Ricans | 0.0 /100 | #323 | Tragic 40.1% |
| Navajo | 0.0 /100 | #324 | Tragic 40.1% |
| Pueblo | 0.0 /100 | #325 | Tragic 40.0% |
| U.S. Virgin Islanders | 0.0 /100 | #326 | Tragic 39.8% |
| Lumbee | 0.0 /100 | #327 | Tragic 39.6% |
| Barbadians | 0.0 /100 | #328 | Tragic 39.4% |
| Immigrants from Dominica | 0.0 /100 | #329 | Tragic 39.4% |
| Immigrants from Barbados | 0.0 /100 | #330 | Tragic 39.2% |
| Immigrants from Congo | 0.0 /100 | #331 | Tragic 39.0% |
| Somalis | 0.0 /100 | #332 | Tragic 39.0% |
| Immigrants from West Indies | 0.0 /100 | #333 | Tragic 39.0% |
| Immigrants from St. Vincent and the Grenadines | 0.0 /100 | #334 | Tragic 38.7% |
Lumbee Married-couple Households Correlation Summary
| Measurement | Lumbee Data | Married-couple Households Data |
| Minimum | 0.041% | 16.8% |
| Maximum | 84.9% | 53.0% |
| Range | 84.9% | 36.2% |
| Mean | 22.4% | 37.4% |
| Median | 11.2% | 37.3% |
| Interquartile 25% (IQ1) | 5.5% | 33.9% |
| Interquartile 75% (IQ3) | 38.3% | 43.5% |
| Interquartile Range (IQR) | 32.8% | 9.7% |
| Standard Deviation (Sample) | 24.2% | 8.3% |
| Standard Deviation (Population) | 23.9% | 8.2% |
Correlation Details
| Lumbee Percentile | Sample Size | Married-couple Households |
[ 0.0% - 0.5% ] 0.041% | 90,451,759 | 41.5% |
[ 0.5% - 1.0% ] 0.65% | 1,119,807 | 45.2% |
[ 1.0% - 1.5% ] 1.20% | 220,793 | 43.4% |
[ 1.5% - 2.0% ] 1.79% | 120,266 | 43.6% |
[ 2.0% - 2.5% ] 2.25% | 81,868 | 44.3% |
[ 2.5% - 3.0% ] 2.71% | 10,026 | 53.0% |
[ 3.0% - 3.5% ] 3.43% | 9,255 | 43.7% |
[ 3.5% - 4.0% ] 3.68% | 9,759 | 44.4% |
[ 4.0% - 4.5% ] 4.27% | 5,527 | 36.6% |
[ 4.5% - 5.0% ] 4.61% | 8,847 | 32.4% |
[ 5.0% - 5.5% ] 5.11% | 6,276 | 40.5% |
[ 5.5% - 6.0% ] 5.88% | 391 | 33.9% |
[ 6.0% - 6.5% ] 6.05% | 2,016 | 36.3% |
[ 6.5% - 7.0% ] 6.70% | 1,418 | 36.2% |
[ 7.0% - 7.5% ] 7.24% | 18,893 | 32.9% |
[ 7.5% - 8.0% ] 7.83% | 1,417 | 50.5% |
[ 8.0% - 8.5% ] 8.27% | 1,548 | 23.1% |
[ 8.5% - 9.0% ] 8.72% | 3,177 | 33.9% |
[ 9.0% - 9.5% ] 9.22% | 965 | 37.9% |
[ 9.5% - 10.0% ] 9.82% | 906 | 36.3% |
[ 10.0% - 10.5% ] 10.47% | 10,588 | 41.4% |
[ 10.5% - 11.0% ] 10.57% | 946 | 37.3% |
[ 11.0% - 11.5% ] 11.24% | 27,494 | 36.2% |
[ 11.5% - 12.0% ] 11.95% | 25,783 | 33.4% |
[ 12.5% - 13.0% ] 12.84% | 4,385 | 27.4% |
[ 13.0% - 13.5% ] 13.47% | 2,272 | 44.5% |
[ 14.5% - 15.0% ] 14.61% | 869 | 38.2% |
[ 15.5% - 16.0% ] 15.52% | 2,519 | 24.5% |
[ 16.5% - 17.0% ] 16.58% | 34,093 | 37.0% |
[ 18.0% - 18.5% ] 18.38% | 3,118 | 34.1% |
[ 20.5% - 21.0% ] 20.57% | 316 | 23.1% |
[ 22.0% - 22.5% ] 22.45% | 245 | 18.3% |
[ 26.5% - 27.0% ] 26.53% | 9,790 | 36.6% |
[ 37.5% - 38.0% ] 37.84% | 37 | 40.9% |
[ 38.5% - 39.0% ] 38.67% | 11,548 | 40.2% |
[ 41.5% - 42.0% ] 41.93% | 5,065 | 34.1% |
[ 48.0% - 48.5% ] 48.45% | 97 | 52.6% |
[ 54.0% - 54.5% ] 54.00% | 300 | 24.0% |
[ 54.0% - 54.5% ] 54.01% | 6,499 | 41.6% |
[ 55.5% - 56.0% ] 55.71% | 29,670 | 37.4% |
[ 62.0% - 62.5% ] 62.12% | 264 | 16.8% |
[ 64.0% - 64.5% ] 64.19% | 12,346 | 36.8% |
[ 79.5% - 80.0% ] 79.59% | 147 | 44.6% |
[ 81.5% - 82.0% ] 81.54% | 650 | 40.0% |
[ 84.5% - 85.0% ] 84.92% | 305 | 51.1% |