Lithuanian Self-Care Disability
COMPARE
Lithuanian
Select to Compare
Self-Care Disability
Lithuanian Self-Care Disability
2.4%
SELF-CARE DISABILITY
98.0/ 100
METRIC RATING
88th/ 347
METRIC RANK
Lithuanian Self-Care Disability Correlation Chart
The statistical analysis conducted on geographies consisting of 421,348,071 people shows a substantial positive correlation between the proportion of Lithuanians and percentage of population with self-care disability in the United States with a correlation coefficient (R) of 0.518 and weighted average of 2.4%. On average, for every 1% (one percent) increase in Lithuanians within a typical geography, there is an increase of 0.17% in percentage of population with self-care disability.
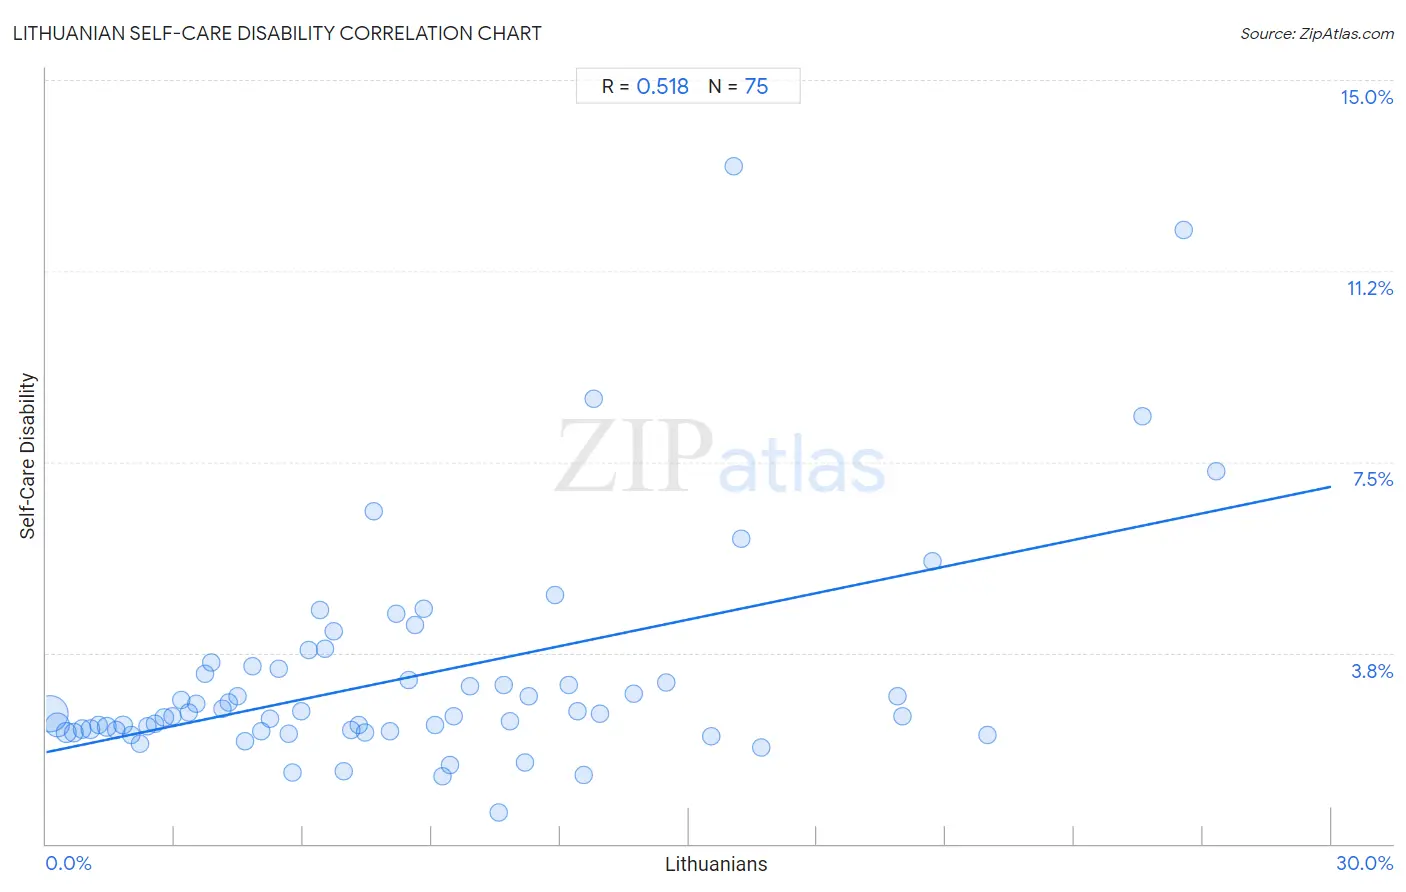
It is essential to understand that the correlation between the percentage of Lithuanians and percentage of population with self-care disability does not imply a direct cause-and-effect relationship. It remains uncertain whether the presence of Lithuanians influences an upward or downward trend in the level of percentage of population with self-care disability within an area, or if Lithuanians simply ended up residing in those areas with higher or lower levels of percentage of population with self-care disability due to other factors.
Demographics Similar to Lithuanians by Self-Care Disability
In terms of self-care disability, the demographic groups most similar to Lithuanians are Sierra Leonean (2.4%, a difference of 0.0%), Immigrants from Congo (2.4%, a difference of 0.050%), Immigrants from Northern Africa (2.3%, a difference of 0.14%), Estonian (2.3%, a difference of 0.16%), and Immigrants from Czechoslovakia (2.4%, a difference of 0.19%).
| Demographics | Rating | Rank | Self-Care Disability |
| Ugandans | 98.8 /100 | #81 | Exceptional 2.3% |
| Immigrants from Denmark | 98.8 /100 | #82 | Exceptional 2.3% |
| Indians (Asian) | 98.7 /100 | #83 | Exceptional 2.3% |
| Immigrants from Spain | 98.7 /100 | #84 | Exceptional 2.3% |
| Estonians | 98.3 /100 | #85 | Exceptional 2.3% |
| Immigrants from Northern Africa | 98.2 /100 | #86 | Exceptional 2.3% |
| Sierra Leoneans | 98.0 /100 | #87 | Exceptional 2.4% |
| Lithuanians | 98.0 /100 | #88 | Exceptional 2.4% |
| Immigrants from Congo | 98.0 /100 | #89 | Exceptional 2.4% |
| Immigrants from Czechoslovakia | 97.7 /100 | #90 | Exceptional 2.4% |
| Immigrants from Jordan | 97.7 /100 | #91 | Exceptional 2.4% |
| Icelanders | 97.4 /100 | #92 | Exceptional 2.4% |
| Immigrants from Latvia | 97.0 /100 | #93 | Exceptional 2.4% |
| Macedonians | 96.9 /100 | #94 | Exceptional 2.4% |
| Immigrants from Asia | 96.9 /100 | #95 | Exceptional 2.4% |
Lithuanian Self-Care Disability Correlation Summary
| Measurement | Lithuanian Data | Self-Care Disability Data |
| Minimum | 0.087% | 0.63% |
| Maximum | 27.3% | 13.3% |
| Range | 27.2% | 12.7% |
| Mean | 8.4% | 3.3% |
| Median | 7.1% | 2.6% |
| Interquartile 25% (IQ1) | 3.5% | 2.2% |
| Interquartile 75% (IQ3) | 11.9% | 3.4% |
| Interquartile Range (IQR) | 8.4% | 1.2% |
| Standard Deviation (Sample) | 6.4% | 2.2% |
| Standard Deviation (Population) | 6.4% | 2.1% |
Correlation Details
| Lithuanian Percentile | Sample Size | Self-Care Disability |
[ 0.0% - 0.5% ] 0.087% | 258,859,001 | 2.6% |
[ 0.0% - 0.5% ] 0.27% | 88,650,494 | 2.3% |
[ 0.0% - 0.5% ] 0.46% | 35,383,071 | 2.2% |
[ 0.5% - 1.0% ] 0.65% | 14,660,067 | 2.2% |
[ 0.5% - 1.0% ] 0.84% | 8,240,325 | 2.2% |
[ 1.0% - 1.5% ] 1.03% | 5,315,206 | 2.2% |
[ 1.0% - 1.5% ] 1.23% | 2,645,568 | 2.3% |
[ 1.0% - 1.5% ] 1.41% | 1,815,578 | 2.3% |
[ 1.5% - 2.0% ] 1.62% | 1,191,532 | 2.2% |
[ 1.5% - 2.0% ] 1.79% | 1,030,930 | 2.3% |
[ 1.5% - 2.0% ] 1.99% | 734,231 | 2.1% |
[ 2.0% - 2.5% ] 2.19% | 680,960 | 2.0% |
[ 2.0% - 2.5% ] 2.37% | 531,204 | 2.3% |
[ 2.5% - 3.0% ] 2.53% | 303,519 | 2.3% |
[ 2.5% - 3.0% ] 2.76% | 275,206 | 2.5% |
[ 2.5% - 3.0% ] 2.93% | 89,937 | 2.5% |
[ 3.0% - 3.5% ] 3.16% | 80,865 | 2.8% |
[ 3.0% - 3.5% ] 3.32% | 93,103 | 2.6% |
[ 3.5% - 4.0% ] 3.52% | 135,813 | 2.8% |
[ 3.5% - 4.0% ] 3.70% | 55,257 | 3.3% |
[ 3.5% - 4.0% ] 3.87% | 24,346 | 3.6% |
[ 4.0% - 4.5% ] 4.12% | 78,623 | 2.7% |
[ 4.0% - 4.5% ] 4.27% | 79,903 | 2.8% |
[ 4.0% - 4.5% ] 4.46% | 40,398 | 2.9% |
[ 4.5% - 5.0% ] 4.63% | 48,063 | 2.0% |
[ 4.5% - 5.0% ] 4.81% | 14,861 | 3.5% |
[ 5.0% - 5.5% ] 5.01% | 73,065 | 2.2% |
[ 5.0% - 5.5% ] 5.21% | 13,091 | 2.5% |
[ 5.0% - 5.5% ] 5.44% | 7,781 | 3.4% |
[ 5.5% - 6.0% ] 5.65% | 6,995 | 2.2% |
[ 5.5% - 6.0% ] 5.75% | 6,072 | 1.4% |
[ 5.5% - 6.0% ] 5.95% | 23,340 | 2.6% |
[ 6.0% - 6.5% ] 6.12% | 2,141 | 3.8% |
[ 6.0% - 6.5% ] 6.38% | 10,735 | 4.6% |
[ 6.5% - 7.0% ] 6.51% | 9,308 | 3.8% |
[ 6.5% - 7.0% ] 6.72% | 2,591 | 4.2% |
[ 6.5% - 7.0% ] 6.94% | 1,513 | 1.4% |
[ 7.0% - 7.5% ] 7.12% | 5,926 | 2.2% |
[ 7.0% - 7.5% ] 7.28% | 6,466 | 2.3% |
[ 7.0% - 7.5% ] 7.45% | 2,631 | 2.2% |
[ 7.5% - 8.0% ] 7.66% | 3,096 | 6.5% |
[ 8.0% - 8.5% ] 8.03% | 7,300 | 2.2% |
[ 8.0% - 8.5% ] 8.18% | 1,394 | 4.5% |
[ 8.0% - 8.5% ] 8.45% | 6,047 | 3.2% |
[ 8.5% - 9.0% ] 8.62% | 441 | 4.3% |
[ 8.5% - 9.0% ] 8.82% | 12,683 | 4.6% |
[ 9.0% - 9.5% ] 9.08% | 3,292 | 2.3% |
[ 9.0% - 9.5% ] 9.24% | 12,486 | 1.3% |
[ 9.0% - 9.5% ] 9.43% | 732 | 1.5% |
[ 9.0% - 9.5% ] 9.50% | 28,149 | 2.5% |
[ 9.5% - 10.0% ] 9.90% | 22,441 | 3.1% |
[ 10.5% - 11.0% ] 10.56% | 161 | 0.63% |
[ 10.5% - 11.0% ] 10.68% | 103 | 3.1% |
[ 10.5% - 11.0% ] 10.82% | 3,411 | 2.4% |
[ 11.0% - 11.5% ] 11.19% | 447 | 1.6% |
[ 11.0% - 11.5% ] 11.26% | 2,940 | 2.9% |
[ 11.5% - 12.0% ] 11.89% | 143 | 4.9% |
[ 12.0% - 12.5% ] 12.19% | 886 | 3.1% |
[ 12.0% - 12.5% ] 12.40% | 1,572 | 2.6% |
[ 12.5% - 13.0% ] 12.54% | 295 | 1.4% |
[ 12.5% - 13.0% ] 12.78% | 1,409 | 8.7% |
[ 12.5% - 13.0% ] 12.94% | 85 | 2.6% |
[ 13.5% - 14.0% ] 13.71% | 875 | 2.9% |
[ 14.0% - 14.5% ] 14.46% | 1,514 | 3.2% |
[ 15.5% - 16.0% ] 15.53% | 1,668 | 2.1% |
[ 16.0% - 16.5% ] 16.04% | 804 | 13.3% |
[ 16.0% - 16.5% ] 16.24% | 234 | 6.0% |
[ 16.5% - 17.0% ] 16.70% | 1,383 | 1.9% |
[ 19.5% - 20.0% ] 19.87% | 1,052 | 2.9% |
[ 20.0% - 20.5% ] 20.00% | 40 | 2.5% |
[ 20.5% - 21.0% ] 20.69% | 145 | 5.6% |
[ 21.5% - 22.0% ] 21.99% | 141 | 2.1% |
[ 25.5% - 26.0% ] 25.60% | 250 | 8.4% |
[ 26.5% - 27.0% ] 26.55% | 531 | 12.1% |
[ 27.0% - 27.5% ] 27.32% | 205 | 7.3% |