Lithuanian Receiving Food Stamps
COMPARE
Lithuanian
Select to Compare
Receiving Food Stamps
Lithuanian Receiving Food Stamps
9.7%
PUBLIC INCOME | FOOD STAMPS
99.4/ 100
METRIC RATING
50th/ 347
METRIC RANK
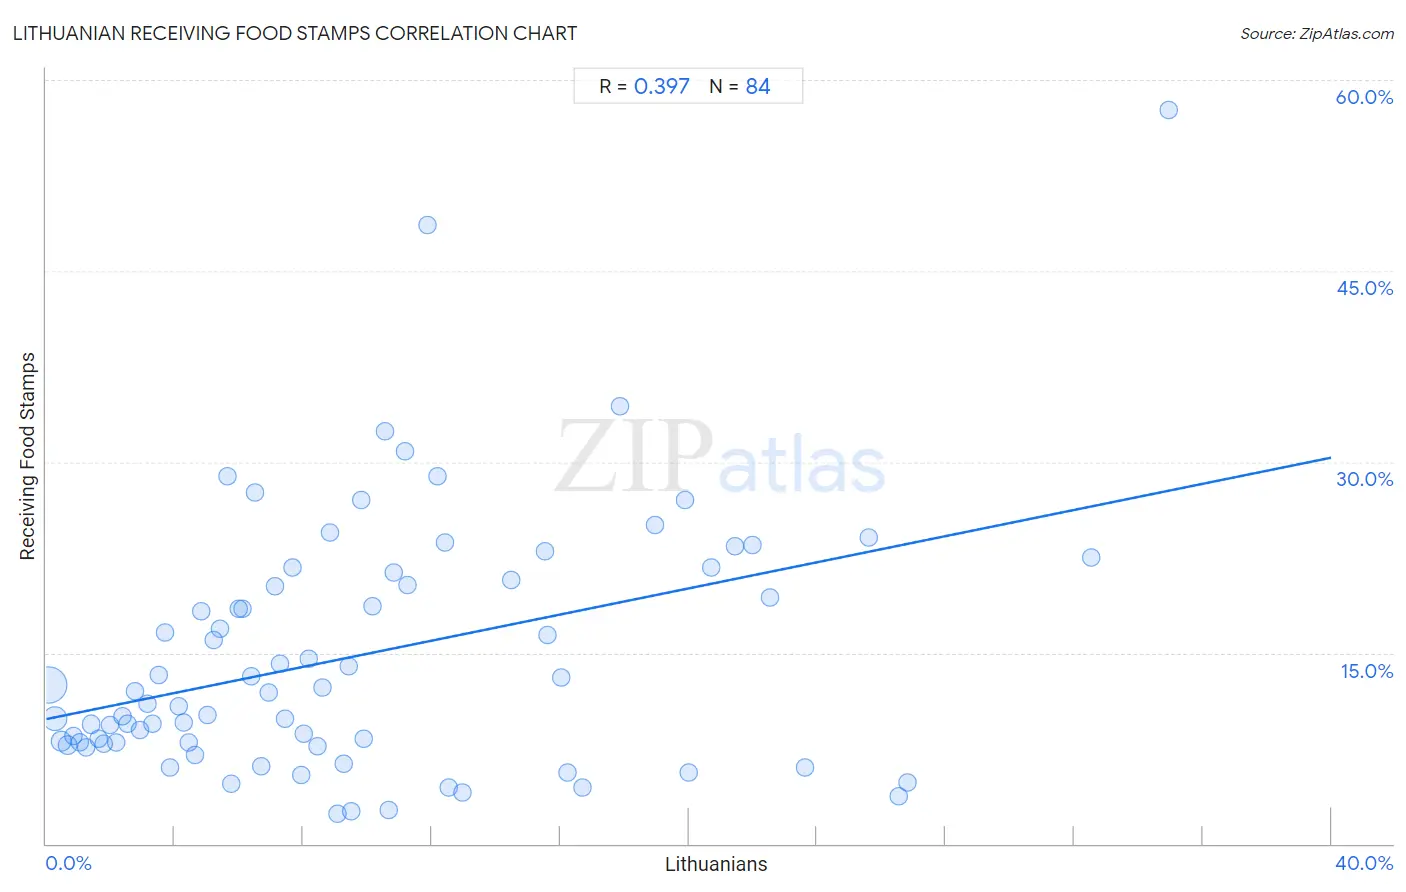
Lithuanian Receiving Food Stamps Correlation Chart
The statistical analysis conducted on geographies consisting of 420,339,892 people shows a mild positive correlation between the proportion of Lithuanians and percentage of population receiving government assistance and/or food stamps in the United States with a correlation coefficient (R) of 0.397 and weighted average of 9.7%. On average, for every 1% (one percent) increase in Lithuanians within a typical geography, there is an increase of 0.51% in percentage of population receiving government assistance and/or food stamps.
It is essential to understand that the correlation between the percentage of Lithuanians and percentage of population receiving government assistance and/or food stamps does not imply a direct cause-and-effect relationship. It remains uncertain whether the presence of Lithuanians influences an upward or downward trend in the level of percentage of population receiving government assistance and/or food stamps within an area, or if Lithuanians simply ended up residing in those areas with higher or lower levels of percentage of population receiving government assistance and/or food stamps due to other factors.
Demographics Similar to Lithuanians by Receiving Food Stamps
In terms of receiving food stamps, the demographic groups most similar to Lithuanians are Asian (9.7%, a difference of 0.18%), Immigrants from South Africa (9.7%, a difference of 0.19%), Tongan (9.7%, a difference of 0.21%), Immigrants from Czechoslovakia (9.6%, a difference of 0.25%), and Russian (9.6%, a difference of 0.27%).
| Demographics | Rating | Rank | Receiving Food Stamps |
| Croatians | 99.5 /100 | #43 | Exceptional 9.6% |
| Immigrants from Denmark | 99.4 /100 | #44 | Exceptional 9.6% |
| Immigrants from Belgium | 99.4 /100 | #45 | Exceptional 9.6% |
| Australians | 99.4 /100 | #46 | Exceptional 9.6% |
| Indians (Asian) | 99.4 /100 | #47 | Exceptional 9.6% |
| Russians | 99.4 /100 | #48 | Exceptional 9.6% |
| Immigrants from Czechoslovakia | 99.4 /100 | #49 | Exceptional 9.6% |
| Lithuanians | 99.4 /100 | #50 | Exceptional 9.7% |
| Asians | 99.3 /100 | #51 | Exceptional 9.7% |
| Immigrants from South Africa | 99.3 /100 | #52 | Exceptional 9.7% |
| Tongans | 99.3 /100 | #53 | Exceptional 9.7% |
| Swiss | 99.3 /100 | #54 | Exceptional 9.7% |
| Immigrants from Switzerland | 99.3 /100 | #55 | Exceptional 9.7% |
| Immigrants from Canada | 99.3 /100 | #56 | Exceptional 9.7% |
| Greeks | 99.3 /100 | #57 | Exceptional 9.7% |
Lithuanian Receiving Food Stamps Correlation Summary
| Measurement | Lithuanian Data | Receiving Food Stamps Data |
| Minimum | 0.087% | 2.4% |
| Maximum | 35.0% | 57.6% |
| Range | 34.9% | 55.2% |
| Mean | 9.8% | 14.8% |
| Median | 8.0% | 11.9% |
| Interquartile 25% (IQ1) | 4.0% | 7.9% |
| Interquartile 75% (IQ3) | 12.7% | 21.0% |
| Interquartile Range (IQR) | 8.7% | 13.1% |
| Standard Deviation (Sample) | 7.8% | 10.0% |
| Standard Deviation (Population) | 7.7% | 10.0% |
Correlation Details
| Lithuanian Percentile | Sample Size | Receiving Food Stamps |
[ 0.0% - 0.5% ] 0.087% | 258,593,456 | 12.5% |
[ 0.0% - 0.5% ] 0.27% | 88,398,084 | 9.8% |
[ 0.0% - 0.5% ] 0.46% | 35,277,090 | 8.1% |
[ 0.5% - 1.0% ] 0.65% | 14,544,670 | 7.8% |
[ 0.5% - 1.0% ] 0.84% | 8,174,269 | 8.5% |
[ 1.0% - 1.5% ] 1.03% | 5,265,313 | 7.9% |
[ 1.0% - 1.5% ] 1.23% | 2,621,687 | 7.6% |
[ 1.0% - 1.5% ] 1.41% | 1,780,568 | 9.4% |
[ 1.5% - 2.0% ] 1.62% | 1,173,691 | 8.3% |
[ 1.5% - 2.0% ] 1.79% | 1,017,277 | 7.9% |
[ 1.5% - 2.0% ] 1.99% | 713,879 | 9.3% |
[ 2.0% - 2.5% ] 2.19% | 668,732 | 7.9% |
[ 2.0% - 2.5% ] 2.37% | 526,841 | 10.0% |
[ 2.5% - 3.0% ] 2.53% | 310,409 | 9.4% |
[ 2.5% - 3.0% ] 2.76% | 277,927 | 12.0% |
[ 2.5% - 3.0% ] 2.93% | 89,403 | 9.0% |
[ 3.0% - 3.5% ] 3.16% | 79,229 | 11.0% |
[ 3.0% - 3.5% ] 3.31% | 82,406 | 9.4% |
[ 3.5% - 4.0% ] 3.52% | 131,260 | 13.3% |
[ 3.5% - 4.0% ] 3.70% | 55,357 | 16.6% |
[ 3.5% - 4.0% ] 3.87% | 23,155 | 6.0% |
[ 4.0% - 4.5% ] 4.13% | 74,636 | 10.8% |
[ 4.0% - 4.5% ] 4.27% | 81,409 | 9.5% |
[ 4.0% - 4.5% ] 4.45% | 38,312 | 7.9% |
[ 4.5% - 5.0% ] 4.63% | 45,125 | 7.0% |
[ 4.5% - 5.0% ] 4.81% | 16,701 | 18.3% |
[ 5.0% - 5.5% ] 5.01% | 71,569 | 10.1% |
[ 5.0% - 5.5% ] 5.21% | 12,965 | 16.0% |
[ 5.0% - 5.5% ] 5.43% | 3,447 | 16.9% |
[ 5.5% - 6.0% ] 5.64% | 7,281 | 28.8% |
[ 5.5% - 6.0% ] 5.76% | 8,287 | 4.7% |
[ 5.5% - 6.0% ] 5.98% | 10,403 | 18.5% |
[ 6.0% - 6.5% ] 6.13% | 2,302 | 18.4% |
[ 6.0% - 6.5% ] 6.38% | 10,735 | 13.2% |
[ 6.5% - 7.0% ] 6.51% | 10,238 | 27.6% |
[ 6.5% - 7.0% ] 6.71% | 3,308 | 6.0% |
[ 6.5% - 7.0% ] 6.94% | 2,061 | 11.9% |
[ 7.0% - 7.5% ] 7.12% | 5,854 | 20.3% |
[ 7.0% - 7.5% ] 7.28% | 6,343 | 14.1% |
[ 7.0% - 7.5% ] 7.45% | 2,631 | 9.8% |
[ 7.5% - 8.0% ] 7.65% | 3,684 | 21.7% |
[ 7.5% - 8.0% ] 7.94% | 1,536 | 5.4% |
[ 8.0% - 8.5% ] 8.03% | 7,300 | 8.6% |
[ 8.0% - 8.5% ] 8.18% | 1,394 | 14.5% |
[ 8.0% - 8.5% ] 8.45% | 6,047 | 7.6% |
[ 8.5% - 9.0% ] 8.62% | 441 | 12.3% |
[ 8.5% - 9.0% ] 8.82% | 13,046 | 24.4% |
[ 9.0% - 9.5% ] 9.08% | 3,680 | 2.4% |
[ 9.0% - 9.5% ] 9.24% | 12,486 | 6.3% |
[ 9.0% - 9.5% ] 9.44% | 1,028 | 14.0% |
[ 9.0% - 9.5% ] 9.50% | 28,223 | 2.6% |
[ 9.5% - 10.0% ] 9.79% | 388 | 27.0% |
[ 9.5% - 10.0% ] 9.90% | 21,663 | 8.3% |
[ 10.0% - 10.5% ] 10.14% | 345 | 18.7% |
[ 10.5% - 11.0% ] 10.56% | 161 | 32.4% |
[ 10.5% - 11.0% ] 10.68% | 103 | 2.7% |
[ 10.5% - 11.0% ] 10.82% | 3,411 | 21.3% |
[ 11.0% - 11.5% ] 11.19% | 447 | 30.8% |
[ 11.0% - 11.5% ] 11.26% | 2,940 | 20.3% |
[ 11.5% - 12.0% ] 11.86% | 59 | 48.6% |
[ 12.0% - 12.5% ] 12.19% | 886 | 28.9% |
[ 12.0% - 12.5% ] 12.40% | 1,572 | 23.7% |
[ 12.5% - 13.0% ] 12.54% | 295 | 4.4% |
[ 12.5% - 13.0% ] 12.94% | 85 | 4.0% |
[ 14.0% - 14.5% ] 14.46% | 1,514 | 20.7% |
[ 15.5% - 16.0% ] 15.53% | 1,668 | 23.0% |
[ 15.5% - 16.0% ] 15.60% | 327 | 16.4% |
[ 16.0% - 16.5% ] 16.04% | 804 | 13.1% |
[ 16.0% - 16.5% ] 16.24% | 234 | 5.6% |
[ 16.5% - 17.0% ] 16.70% | 1,383 | 4.4% |
[ 17.5% - 18.0% ] 17.86% | 308 | 34.4% |
[ 18.5% - 19.0% ] 18.97% | 116 | 25.0% |
[ 19.5% - 20.0% ] 19.87% | 1,052 | 27.0% |
[ 20.0% - 20.5% ] 20.00% | 40 | 5.6% |
[ 20.5% - 21.0% ] 20.69% | 145 | 21.7% |
[ 21.0% - 21.5% ] 21.46% | 494 | 23.4% |
[ 21.5% - 22.0% ] 21.99% | 141 | 23.5% |
[ 22.5% - 23.0% ] 22.52% | 595 | 19.3% |
[ 23.5% - 24.0% ] 23.64% | 110 | 6.0% |
[ 25.5% - 26.0% ] 25.60% | 250 | 24.1% |
[ 26.5% - 27.0% ] 26.55% | 531 | 3.7% |
[ 26.5% - 27.0% ] 26.81% | 235 | 4.8% |
[ 32.5% - 33.0% ] 32.54% | 209 | 22.5% |
[ 34.5% - 35.0% ] 34.95% | 206 | 57.6% |