Lithuanian 4 or more Vehicles in Household
COMPARE
Lithuanian
Select to Compare
4 or more Vehicles in Household
Lithuanian 4 or more Vehicles in Household
6.3%
4+ VEHICLES AVAILABLE
50.0/ 100
METRIC RATING
174th/ 347
METRIC RANK
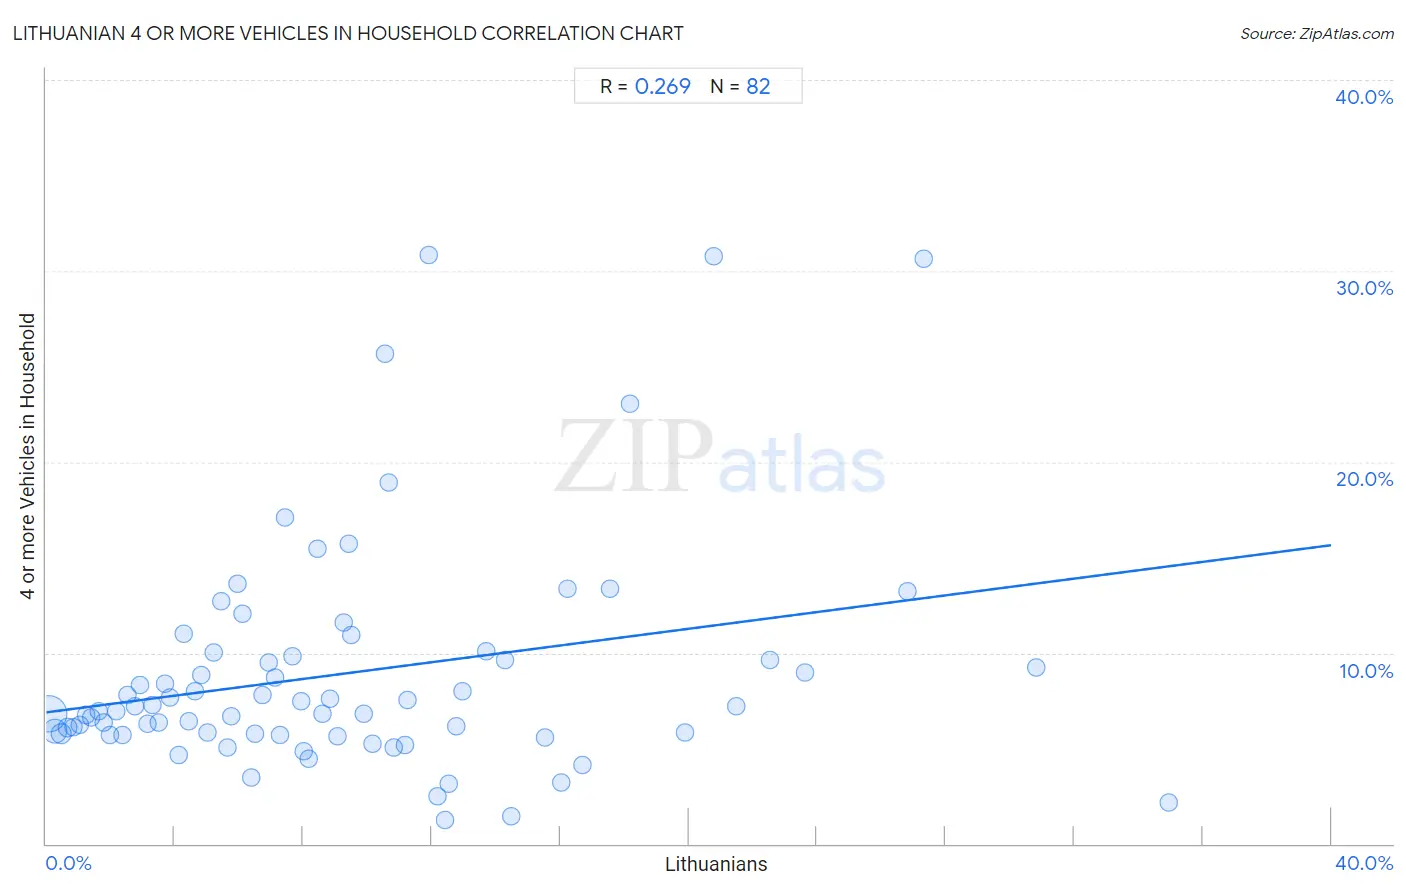
Lithuanian 4 or more Vehicles in Household Correlation Chart
The statistical analysis conducted on geographies consisting of 420,091,012 people shows a weak positive correlation between the proportion of Lithuanians and percentage of households with 4 or more vehicles available in the United States with a correlation coefficient (R) of 0.269 and weighted average of 6.3%. On average, for every 1% (one percent) increase in Lithuanians within a typical geography, there is an increase of 0.22% in percentage of households with 4 or more vehicles available.
It is essential to understand that the correlation between the percentage of Lithuanians and percentage of households with 4 or more vehicles available does not imply a direct cause-and-effect relationship. It remains uncertain whether the presence of Lithuanians influences an upward or downward trend in the level of percentage of households with 4 or more vehicles available within an area, or if Lithuanians simply ended up residing in those areas with higher or lower levels of percentage of households with 4 or more vehicles available due to other factors.
Demographics Similar to Lithuanians by 4 or more Vehicles in Household
In terms of 4 or more vehicles in household, the demographic groups most similar to Lithuanians are Slovene (6.3%, a difference of 0.12%), Immigrants from Western Europe (6.3%, a difference of 0.12%), Immigrants from Lebanon (6.3%, a difference of 0.17%), Immigrants from India (6.3%, a difference of 0.20%), and Ukrainian (6.3%, a difference of 0.24%).
| Demographics | Rating | Rank | 4 or more Vehicles in Household |
| Poles | 56.9 /100 | #167 | Average 6.4% |
| Lebanese | 55.8 /100 | #168 | Average 6.4% |
| Estonians | 55.1 /100 | #169 | Average 6.4% |
| Immigrants from Syria | 52.8 /100 | #170 | Average 6.3% |
| Immigrants from India | 51.9 /100 | #171 | Average 6.3% |
| Immigrants from Lebanon | 51.7 /100 | #172 | Average 6.3% |
| Slovenes | 51.1 /100 | #173 | Average 6.3% |
| Lithuanians | 50.0 /100 | #174 | Average 6.3% |
| Immigrants from Western Europe | 48.8 /100 | #175 | Average 6.3% |
| Ukrainians | 47.6 /100 | #176 | Average 6.3% |
| Slovaks | 46.9 /100 | #177 | Average 6.3% |
| Belizeans | 44.5 /100 | #178 | Average 6.3% |
| Immigrants from Japan | 43.1 /100 | #179 | Average 6.3% |
| Syrians | 42.0 /100 | #180 | Average 6.3% |
| Yugoslavians | 41.1 /100 | #181 | Average 6.3% |
Lithuanian 4 or more Vehicles in Household Correlation Summary
| Measurement | Lithuanian Data | 4 or more Vehicles in Household Data |
| Minimum | 0.087% | 1.3% |
| Maximum | 35.0% | 30.8% |
| Range | 34.9% | 29.6% |
| Mean | 9.4% | 8.9% |
| Median | 7.8% | 7.1% |
| Interquartile 25% (IQ1) | 3.9% | 5.8% |
| Interquartile 75% (IQ3) | 12.5% | 9.8% |
| Interquartile Range (IQR) | 8.7% | 4.1% |
| Standard Deviation (Sample) | 7.4% | 6.0% |
| Standard Deviation (Population) | 7.3% | 6.0% |
Correlation Details
| Lithuanian Percentile | Sample Size | 4 or more Vehicles in Household |
[ 0.0% - 0.5% ] 0.087% | 258,233,902 | 6.8% |
[ 0.0% - 0.5% ] 0.27% | 88,309,333 | 5.9% |
[ 0.0% - 0.5% ] 0.46% | 35,193,673 | 5.8% |
[ 0.5% - 1.0% ] 0.65% | 14,576,927 | 6.1% |
[ 0.5% - 1.0% ] 0.84% | 8,198,978 | 6.1% |
[ 1.0% - 1.5% ] 1.03% | 5,309,906 | 6.2% |
[ 1.0% - 1.5% ] 1.23% | 2,642,242 | 6.8% |
[ 1.0% - 1.5% ] 1.41% | 1,817,065 | 6.6% |
[ 1.5% - 2.0% ] 1.62% | 1,190,703 | 6.9% |
[ 1.5% - 2.0% ] 1.79% | 1,039,162 | 6.3% |
[ 1.5% - 2.0% ] 1.99% | 735,440 | 5.7% |
[ 2.0% - 2.5% ] 2.19% | 672,987 | 7.0% |
[ 2.0% - 2.5% ] 2.37% | 532,529 | 5.7% |
[ 2.5% - 3.0% ] 2.53% | 312,111 | 7.8% |
[ 2.5% - 3.0% ] 2.76% | 276,415 | 7.2% |
[ 2.5% - 3.0% ] 2.93% | 89,796 | 8.3% |
[ 3.0% - 3.5% ] 3.16% | 82,696 | 6.3% |
[ 3.0% - 3.5% ] 3.32% | 90,349 | 7.3% |
[ 3.5% - 4.0% ] 3.52% | 134,677 | 6.4% |
[ 3.5% - 4.0% ] 3.70% | 54,757 | 8.4% |
[ 3.5% - 4.0% ] 3.87% | 24,190 | 7.6% |
[ 4.0% - 4.5% ] 4.13% | 78,663 | 4.7% |
[ 4.0% - 4.5% ] 4.27% | 82,381 | 11.0% |
[ 4.0% - 4.5% ] 4.46% | 39,662 | 6.4% |
[ 4.5% - 5.0% ] 4.63% | 48,835 | 8.0% |
[ 4.5% - 5.0% ] 4.81% | 15,187 | 8.8% |
[ 5.0% - 5.5% ] 5.01% | 71,727 | 5.8% |
[ 5.0% - 5.5% ] 5.23% | 18,289 | 10.0% |
[ 5.0% - 5.5% ] 5.44% | 8,000 | 12.7% |
[ 5.5% - 6.0% ] 5.64% | 7,281 | 5.1% |
[ 5.5% - 6.0% ] 5.75% | 8,499 | 6.7% |
[ 5.5% - 6.0% ] 5.95% | 23,159 | 13.6% |
[ 6.0% - 6.5% ] 6.09% | 5,877 | 12.0% |
[ 6.0% - 6.5% ] 6.38% | 10,735 | 3.5% |
[ 6.5% - 7.0% ] 6.51% | 9,308 | 5.8% |
[ 6.5% - 7.0% ] 6.72% | 2,546 | 7.8% |
[ 6.5% - 7.0% ] 6.94% | 2,061 | 9.5% |
[ 7.0% - 7.5% ] 7.12% | 6,150 | 8.7% |
[ 7.0% - 7.5% ] 7.28% | 6,343 | 5.7% |
[ 7.0% - 7.5% ] 7.45% | 2,631 | 17.1% |
[ 7.5% - 8.0% ] 7.66% | 3,317 | 9.8% |
[ 7.5% - 8.0% ] 7.94% | 2,014 | 7.5% |
[ 8.0% - 8.5% ] 8.03% | 7,300 | 4.8% |
[ 8.0% - 8.5% ] 8.18% | 1,394 | 4.4% |
[ 8.0% - 8.5% ] 8.46% | 7,353 | 15.4% |
[ 8.5% - 9.0% ] 8.62% | 441 | 6.8% |
[ 8.5% - 9.0% ] 8.82% | 13,179 | 7.6% |
[ 9.0% - 9.5% ] 9.08% | 3,834 | 5.6% |
[ 9.0% - 9.5% ] 9.24% | 12,486 | 11.6% |
[ 9.0% - 9.5% ] 9.44% | 1,028 | 15.7% |
[ 9.0% - 9.5% ] 9.50% | 27,970 | 10.9% |
[ 9.5% - 10.0% ] 9.90% | 22,441 | 6.8% |
[ 10.0% - 10.5% ] 10.14% | 345 | 5.2% |
[ 10.5% - 11.0% ] 10.56% | 161 | 25.7% |
[ 10.5% - 11.0% ] 10.68% | 103 | 18.9% |
[ 10.5% - 11.0% ] 10.82% | 3,411 | 5.0% |
[ 11.0% - 11.5% ] 11.19% | 447 | 5.1% |
[ 11.0% - 11.5% ] 11.26% | 3,243 | 7.6% |
[ 11.5% - 12.0% ] 11.91% | 361 | 30.8% |
[ 12.0% - 12.5% ] 12.19% | 886 | 2.5% |
[ 12.0% - 12.5% ] 12.40% | 1,572 | 1.3% |
[ 12.5% - 13.0% ] 12.54% | 295 | 3.2% |
[ 12.5% - 13.0% ] 12.78% | 1,409 | 6.2% |
[ 12.5% - 13.0% ] 12.94% | 85 | 8.0% |
[ 13.5% - 14.0% ] 13.71% | 875 | 10.1% |
[ 14.0% - 14.5% ] 14.29% | 231 | 9.6% |
[ 14.0% - 14.5% ] 14.46% | 1,514 | 1.4% |
[ 15.5% - 16.0% ] 15.53% | 1,668 | 5.5% |
[ 16.0% - 16.5% ] 16.04% | 804 | 3.2% |
[ 16.0% - 16.5% ] 16.24% | 234 | 13.3% |
[ 16.5% - 17.0% ] 16.70% | 1,383 | 4.1% |
[ 17.5% - 18.0% ] 17.54% | 57 | 13.3% |
[ 18.0% - 18.5% ] 18.18% | 44 | 23.1% |
[ 19.5% - 20.0% ] 19.87% | 1,052 | 5.8% |
[ 20.5% - 21.0% ] 20.79% | 433 | 30.8% |
[ 21.0% - 21.5% ] 21.47% | 652 | 7.2% |
[ 22.5% - 23.0% ] 22.52% | 595 | 9.6% |
[ 23.5% - 24.0% ] 23.64% | 110 | 9.0% |
[ 26.5% - 27.0% ] 26.81% | 235 | 13.3% |
[ 27.0% - 27.5% ] 27.32% | 205 | 30.7% |
[ 30.5% - 31.0% ] 30.84% | 467 | 9.2% |
[ 34.5% - 35.0% ] 34.95% | 206 | 2.2% |