Lithuanian Female Disability
COMPARE
Lithuanian
Select to Compare
Female Disability
Lithuanian Female Disability
12.2%
DISABILITY | FEMALES
59.5/ 100
METRIC RATING
166th/ 347
METRIC RANK
Lithuanian Female Disability Correlation Chart
The statistical analysis conducted on geographies consisting of 421,926,295 people shows a mild positive correlation between the proportion of Lithuanians and percentage of females with a disability in the United States with a correlation coefficient (R) of 0.329 and weighted average of 12.2%. On average, for every 1% (one percent) increase in Lithuanians within a typical geography, there is an increase of 0.40% in percentage of females with a disability.
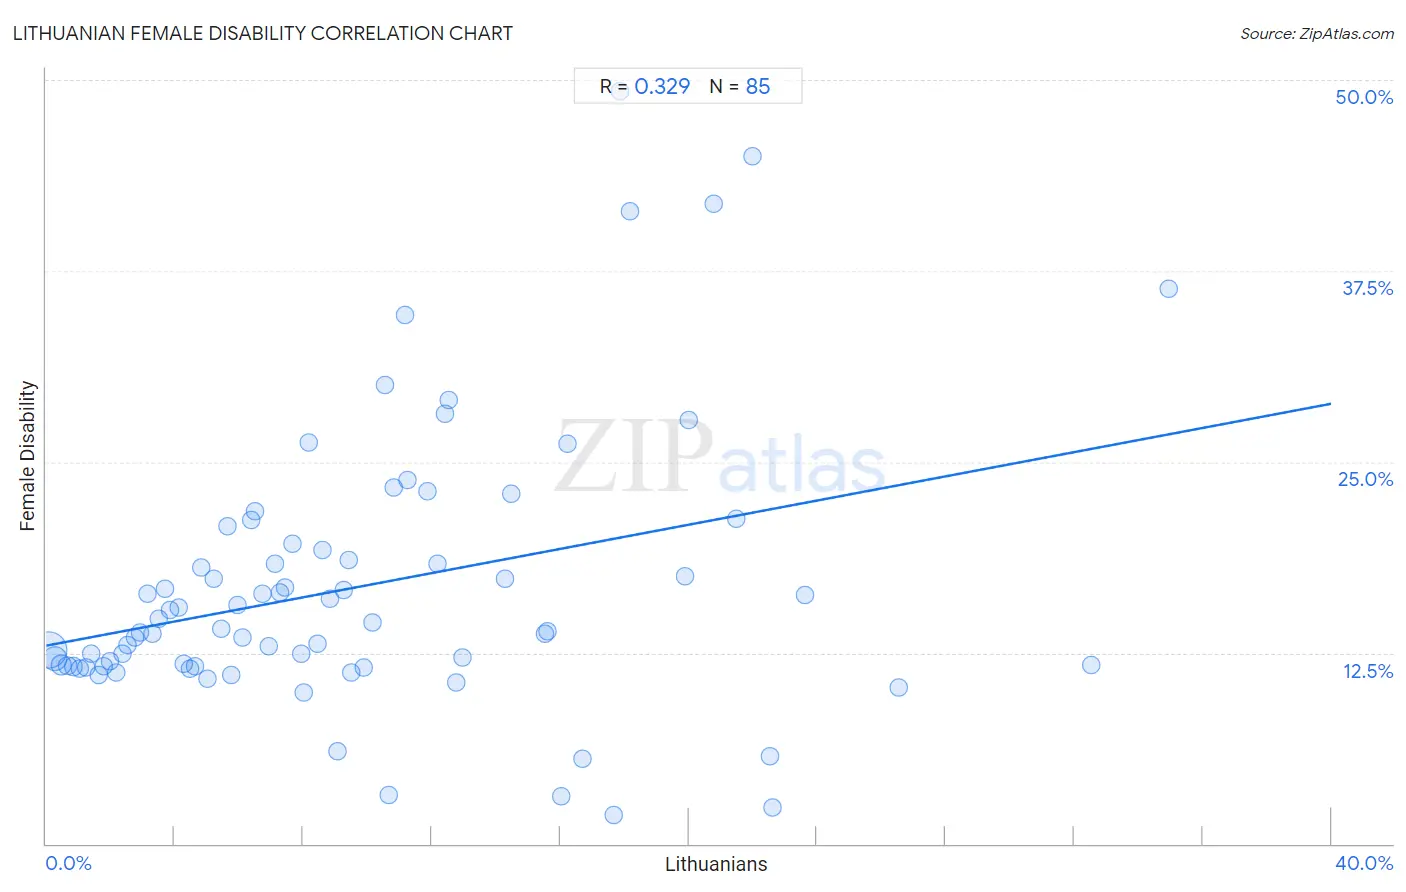
It is essential to understand that the correlation between the percentage of Lithuanians and percentage of females with a disability does not imply a direct cause-and-effect relationship. It remains uncertain whether the presence of Lithuanians influences an upward or downward trend in the level of percentage of females with a disability within an area, or if Lithuanians simply ended up residing in those areas with higher or lower levels of percentage of females with a disability due to other factors.
Demographics Similar to Lithuanians by Female Disability
In terms of female disability, the demographic groups most similar to Lithuanians are Immigrants from Latin America (12.2%, a difference of 0.020%), Immigrants from Haiti (12.2%, a difference of 0.030%), Lebanese (12.2%, a difference of 0.050%), Immigrants from Oceania (12.1%, a difference of 0.090%), and Maltese (12.2%, a difference of 0.10%).
| Demographics | Rating | Rank | Female Disability |
| Immigrants from Central America | 67.7 /100 | #159 | Good 12.1% |
| Immigrants from Guatemala | 66.0 /100 | #160 | Good 12.1% |
| Guyanese | 64.7 /100 | #161 | Good 12.1% |
| Immigrants from Ukraine | 64.3 /100 | #162 | Good 12.1% |
| Guatemalans | 63.8 /100 | #163 | Good 12.1% |
| Czechs | 63.6 /100 | #164 | Good 12.1% |
| Immigrants from Oceania | 61.8 /100 | #165 | Good 12.1% |
| Lithuanians | 59.5 /100 | #166 | Average 12.2% |
| Immigrants from Latin America | 59.0 /100 | #167 | Average 12.2% |
| Immigrants from Haiti | 58.8 /100 | #168 | Average 12.2% |
| Lebanese | 58.1 /100 | #169 | Average 12.2% |
| Maltese | 57.0 /100 | #170 | Average 12.2% |
| Immigrants from Southern Europe | 56.3 /100 | #171 | Average 12.2% |
| Haitians | 51.9 /100 | #172 | Average 12.2% |
| Immigrants from Mexico | 50.8 /100 | #173 | Average 12.2% |
Lithuanian Female Disability Correlation Summary
| Measurement | Lithuanian Data | Female Disability Data |
| Minimum | 0.087% | 1.9% |
| Maximum | 35.0% | 49.2% |
| Range | 34.9% | 47.3% |
| Mean | 9.7% | 16.8% |
| Median | 8.0% | 14.0% |
| Interquartile 25% (IQ1) | 4.0% | 11.6% |
| Interquartile 75% (IQ3) | 13.6% | 19.4% |
| Interquartile Range (IQR) | 9.6% | 7.8% |
| Standard Deviation (Sample) | 7.5% | 9.0% |
| Standard Deviation (Population) | 7.4% | 9.0% |
Correlation Details
| Lithuanian Percentile | Sample Size | Female Disability |
[ 0.0% - 0.5% ] 0.087% | 258,990,842 | 12.7% |
[ 0.0% - 0.5% ] 0.27% | 88,753,171 | 12.1% |
[ 0.0% - 0.5% ] 0.46% | 35,467,114 | 11.7% |
[ 0.5% - 1.0% ] 0.65% | 14,720,357 | 11.6% |
[ 0.5% - 1.0% ] 0.84% | 8,293,072 | 11.6% |
[ 1.0% - 1.5% ] 1.03% | 5,349,684 | 11.5% |
[ 1.0% - 1.5% ] 1.23% | 2,656,320 | 11.6% |
[ 1.0% - 1.5% ] 1.41% | 1,823,344 | 12.5% |
[ 1.5% - 2.0% ] 1.62% | 1,208,429 | 11.1% |
[ 1.5% - 2.0% ] 1.79% | 1,041,262 | 11.6% |
[ 1.5% - 2.0% ] 1.99% | 741,913 | 11.9% |
[ 2.0% - 2.5% ] 2.19% | 683,369 | 11.2% |
[ 2.0% - 2.5% ] 2.37% | 533,397 | 12.4% |
[ 2.5% - 3.0% ] 2.53% | 313,959 | 13.0% |
[ 2.5% - 3.0% ] 2.76% | 281,005 | 13.5% |
[ 2.5% - 3.0% ] 2.93% | 90,345 | 13.8% |
[ 3.0% - 3.5% ] 3.16% | 83,140 | 16.4% |
[ 3.0% - 3.5% ] 3.32% | 96,660 | 13.7% |
[ 3.5% - 4.0% ] 3.52% | 136,192 | 14.7% |
[ 3.5% - 4.0% ] 3.70% | 56,913 | 16.7% |
[ 3.5% - 4.0% ] 3.87% | 24,346 | 15.3% |
[ 4.0% - 4.5% ] 4.12% | 79,360 | 15.4% |
[ 4.0% - 4.5% ] 4.27% | 81,545 | 11.8% |
[ 4.0% - 4.5% ] 4.46% | 40,826 | 11.5% |
[ 4.5% - 5.0% ] 4.63% | 49,892 | 11.6% |
[ 4.5% - 5.0% ] 4.81% | 16,414 | 18.1% |
[ 5.0% - 5.5% ] 5.01% | 73,509 | 10.8% |
[ 5.0% - 5.5% ] 5.22% | 17,444 | 17.3% |
[ 5.0% - 5.5% ] 5.44% | 8,000 | 14.0% |
[ 5.5% - 6.0% ] 5.64% | 7,443 | 20.8% |
[ 5.5% - 6.0% ] 5.76% | 8,962 | 11.1% |
[ 5.5% - 6.0% ] 5.95% | 23,657 | 15.7% |
[ 6.0% - 6.5% ] 6.09% | 5,877 | 13.5% |
[ 6.0% - 6.5% ] 6.38% | 10,203 | 21.2% |
[ 6.5% - 7.0% ] 6.51% | 10,011 | 21.8% |
[ 6.5% - 7.0% ] 6.72% | 2,635 | 16.4% |
[ 6.5% - 7.0% ] 6.94% | 2,191 | 12.9% |
[ 7.0% - 7.5% ] 7.12% | 6,618 | 18.3% |
[ 7.0% - 7.5% ] 7.28% | 6,466 | 16.4% |
[ 7.0% - 7.5% ] 7.45% | 2,712 | 16.8% |
[ 7.5% - 8.0% ] 7.65% | 3,907 | 19.6% |
[ 7.5% - 8.0% ] 7.94% | 2,014 | 12.4% |
[ 8.0% - 8.5% ] 8.03% | 7,300 | 9.9% |
[ 8.0% - 8.5% ] 8.18% | 1,394 | 26.2% |
[ 8.0% - 8.5% ] 8.46% | 7,353 | 13.1% |
[ 8.5% - 9.0% ] 8.62% | 441 | 19.2% |
[ 8.5% - 9.0% ] 8.82% | 13,542 | 16.0% |
[ 9.0% - 9.5% ] 9.08% | 3,834 | 6.1% |
[ 9.0% - 9.5% ] 9.24% | 12,486 | 16.6% |
[ 9.0% - 9.5% ] 9.44% | 1,028 | 18.6% |
[ 9.5% - 10.0% ] 9.50% | 28,892 | 11.2% |
[ 9.5% - 10.0% ] 9.90% | 22,441 | 11.5% |
[ 10.0% - 10.5% ] 10.14% | 345 | 14.5% |
[ 10.5% - 11.0% ] 10.56% | 161 | 30.0% |
[ 10.5% - 11.0% ] 10.68% | 103 | 3.2% |
[ 10.5% - 11.0% ] 10.82% | 3,411 | 23.3% |
[ 11.0% - 11.5% ] 11.19% | 447 | 34.6% |
[ 11.0% - 11.5% ] 11.26% | 2,940 | 23.8% |
[ 11.5% - 12.0% ] 11.86% | 59 | 23.1% |
[ 12.0% - 12.5% ] 12.19% | 886 | 18.3% |
[ 12.0% - 12.5% ] 12.40% | 1,572 | 28.2% |
[ 12.5% - 13.0% ] 12.54% | 295 | 29.1% |
[ 12.5% - 13.0% ] 12.78% | 1,409 | 10.5% |
[ 12.5% - 13.0% ] 12.94% | 85 | 12.2% |
[ 14.0% - 14.5% ] 14.29% | 161 | 17.3% |
[ 14.0% - 14.5% ] 14.46% | 1,514 | 22.9% |
[ 15.5% - 16.0% ] 15.53% | 1,668 | 13.8% |
[ 15.5% - 16.0% ] 15.60% | 327 | 13.9% |
[ 16.0% - 16.5% ] 16.04% | 804 | 3.1% |
[ 16.0% - 16.5% ] 16.24% | 234 | 26.2% |
[ 16.5% - 17.0% ] 16.70% | 1,383 | 5.6% |
[ 17.5% - 18.0% ] 17.67% | 249 | 1.9% |
[ 17.5% - 18.0% ] 17.86% | 308 | 49.2% |
[ 18.0% - 18.5% ] 18.18% | 44 | 41.4% |
[ 19.5% - 20.0% ] 19.87% | 1,052 | 17.5% |
[ 20.0% - 20.5% ] 20.00% | 40 | 27.8% |
[ 20.5% - 21.0% ] 20.79% | 433 | 41.9% |
[ 21.0% - 21.5% ] 21.47% | 652 | 21.3% |
[ 21.5% - 22.0% ] 21.99% | 141 | 45.0% |
[ 22.5% - 23.0% ] 22.52% | 595 | 5.7% |
[ 22.5% - 23.0% ] 22.61% | 690 | 2.4% |
[ 23.5% - 24.0% ] 23.64% | 110 | 16.3% |
[ 26.5% - 27.0% ] 26.55% | 531 | 10.2% |
[ 32.5% - 33.0% ] 32.54% | 209 | 11.7% |
[ 34.5% - 35.0% ] 34.95% | 206 | 36.4% |