Lithuanian Male Disability
COMPARE
Lithuanian
Select to Compare
Male Disability
Lithuanian Male Disability
11.6%
DISABILITY | MALES
6.6/ 100
METRIC RATING
214th/ 347
METRIC RANK
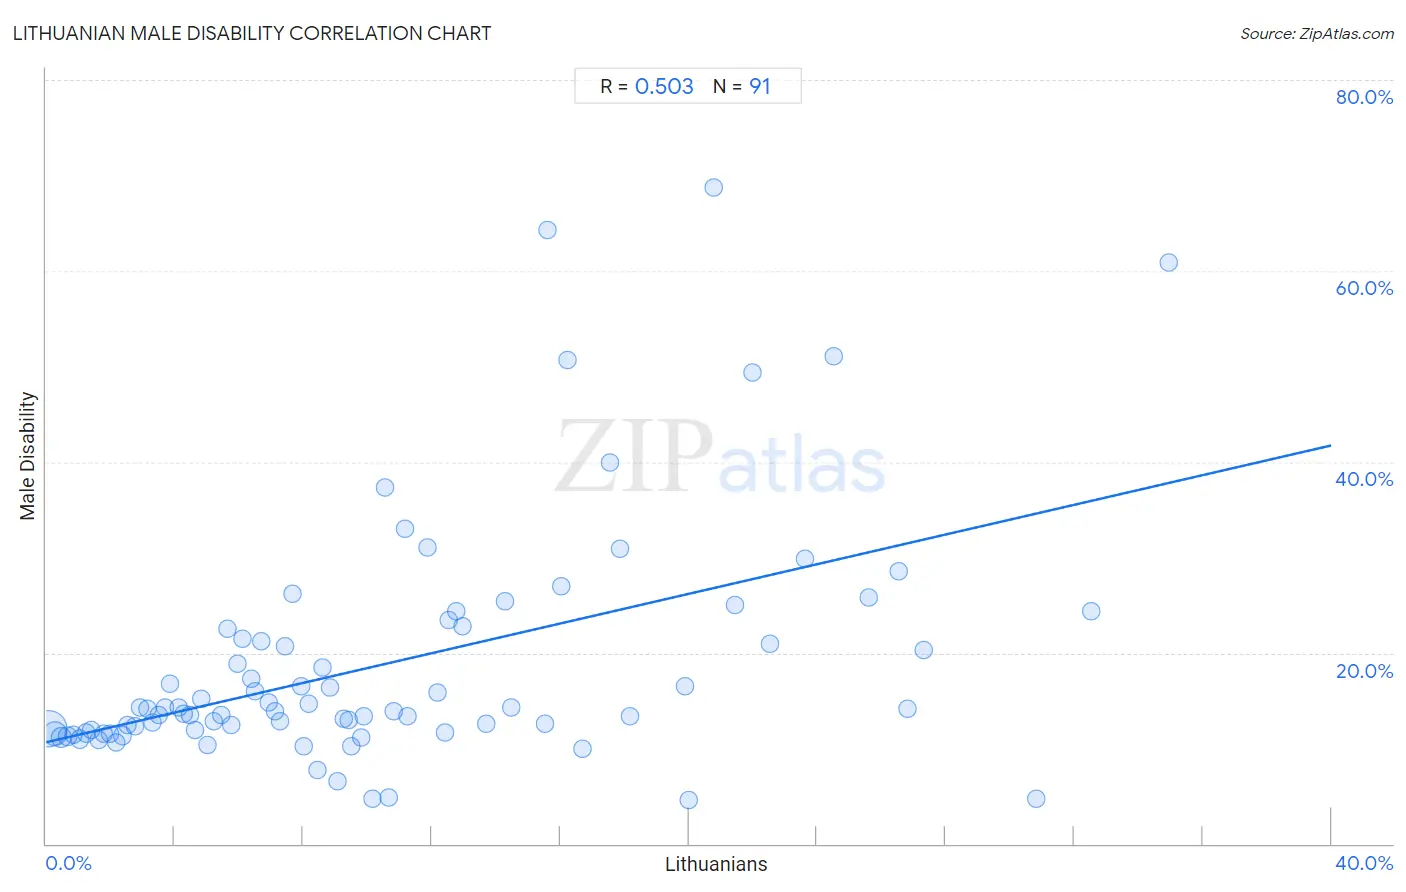
Lithuanian Male Disability Correlation Chart
The statistical analysis conducted on geographies consisting of 421,914,182 people shows a substantial positive correlation between the proportion of Lithuanians and percentage of males with a disability in the United States with a correlation coefficient (R) of 0.503 and weighted average of 11.6%. On average, for every 1% (one percent) increase in Lithuanians within a typical geography, there is an increase of 0.78% in percentage of males with a disability.
It is essential to understand that the correlation between the percentage of Lithuanians and percentage of males with a disability does not imply a direct cause-and-effect relationship. It remains uncertain whether the presence of Lithuanians influences an upward or downward trend in the level of percentage of males with a disability within an area, or if Lithuanians simply ended up residing in those areas with higher or lower levels of percentage of males with a disability due to other factors.
Demographics Similar to Lithuanians by Male Disability
In terms of male disability, the demographic groups most similar to Lithuanians are Indonesian (11.6%, a difference of 0.16%), Mexican American Indian (11.6%, a difference of 0.24%), Immigrants from Scotland (11.6%, a difference of 0.32%), Immigrants from Thailand (11.6%, a difference of 0.35%), and Immigrants from Dominican Republic (11.7%, a difference of 0.44%).
| Demographics | Rating | Rank | Male Disability |
| Immigrants from Somalia | 10.4 /100 | #207 | Poor 11.5% |
| Icelanders | 10.1 /100 | #208 | Poor 11.6% |
| Spanish American Indians | 10.1 /100 | #209 | Poor 11.6% |
| Ute | 9.4 /100 | #210 | Tragic 11.6% |
| Immigrants from Thailand | 8.4 /100 | #211 | Tragic 11.6% |
| Immigrants from Scotland | 8.2 /100 | #212 | Tragic 11.6% |
| Mexican American Indians | 7.8 /100 | #213 | Tragic 11.6% |
| Lithuanians | 6.6 /100 | #214 | Tragic 11.6% |
| Indonesians | 5.9 /100 | #215 | Tragic 11.6% |
| Immigrants from Dominican Republic | 4.9 /100 | #216 | Tragic 11.7% |
| Immigrants from Dominica | 4.6 /100 | #217 | Tragic 11.7% |
| Immigrants from England | 4.0 /100 | #218 | Tragic 11.7% |
| Panamanians | 3.8 /100 | #219 | Tragic 11.7% |
| Immigrants from Western Europe | 3.8 /100 | #220 | Tragic 11.7% |
| Immigrants from Congo | 3.7 /100 | #221 | Tragic 11.7% |
Lithuanian Male Disability Correlation Summary
| Measurement | Lithuanian Data | Male Disability Data |
| Minimum | 0.087% | 4.5% |
| Maximum | 35.0% | 68.7% |
| Range | 34.9% | 64.1% |
| Mean | 10.6% | 18.8% |
| Median | 8.6% | 14.1% |
| Interquartile 25% (IQ1) | 4.3% | 11.6% |
| Interquartile 75% (IQ3) | 15.5% | 22.5% |
| Interquartile Range (IQR) | 11.3% | 10.9% |
| Standard Deviation (Sample) | 8.2% | 12.6% |
| Standard Deviation (Population) | 8.1% | 12.5% |
Correlation Details
| Lithuanian Percentile | Sample Size | Male Disability |
[ 0.0% - 0.5% ] 0.087% | 258,979,430 | 12.0% |
[ 0.0% - 0.5% ] 0.27% | 88,748,398 | 11.6% |
[ 0.0% - 0.5% ] 0.46% | 35,462,563 | 11.1% |
[ 0.5% - 1.0% ] 0.65% | 14,722,374 | 11.2% |
[ 0.5% - 1.0% ] 0.84% | 8,293,502 | 11.4% |
[ 1.0% - 1.5% ] 1.03% | 5,349,886 | 11.0% |
[ 1.0% - 1.5% ] 1.23% | 2,656,907 | 11.6% |
[ 1.0% - 1.5% ] 1.41% | 1,823,344 | 11.9% |
[ 1.5% - 2.0% ] 1.62% | 1,207,614 | 10.9% |
[ 1.5% - 2.0% ] 1.79% | 1,041,262 | 11.6% |
[ 1.5% - 2.0% ] 1.99% | 742,265 | 11.5% |
[ 2.0% - 2.5% ] 2.19% | 682,450 | 10.6% |
[ 2.0% - 2.5% ] 2.37% | 532,660 | 11.3% |
[ 2.5% - 3.0% ] 2.53% | 314,880 | 12.4% |
[ 2.5% - 3.0% ] 2.76% | 281,005 | 12.3% |
[ 2.5% - 3.0% ] 2.93% | 90,345 | 14.2% |
[ 3.0% - 3.5% ] 3.16% | 83,623 | 14.1% |
[ 3.0% - 3.5% ] 3.32% | 97,616 | 12.7% |
[ 3.5% - 4.0% ] 3.52% | 136,192 | 13.5% |
[ 3.5% - 4.0% ] 3.70% | 57,190 | 14.2% |
[ 3.5% - 4.0% ] 3.86% | 24,919 | 16.7% |
[ 4.0% - 4.5% ] 4.12% | 79,184 | 14.3% |
[ 4.0% - 4.5% ] 4.27% | 82,566 | 13.6% |
[ 4.0% - 4.5% ] 4.46% | 40,689 | 13.5% |
[ 4.5% - 5.0% ] 4.63% | 49,892 | 12.0% |
[ 4.5% - 5.0% ] 4.81% | 16,701 | 15.1% |
[ 5.0% - 5.5% ] 5.01% | 73,351 | 10.4% |
[ 5.0% - 5.5% ] 5.22% | 17,842 | 12.9% |
[ 5.0% - 5.5% ] 5.44% | 8,056 | 13.5% |
[ 5.5% - 6.0% ] 5.64% | 7,459 | 22.5% |
[ 5.5% - 6.0% ] 5.76% | 8,962 | 12.5% |
[ 5.5% - 6.0% ] 5.95% | 23,657 | 18.8% |
[ 6.0% - 6.5% ] 6.09% | 5,877 | 21.4% |
[ 6.0% - 6.5% ] 6.38% | 10,735 | 17.3% |
[ 6.5% - 7.0% ] 6.51% | 10,011 | 16.0% |
[ 6.5% - 7.0% ] 6.71% | 3,397 | 21.3% |
[ 6.5% - 7.0% ] 6.94% | 2,061 | 14.8% |
[ 7.0% - 7.5% ] 7.12% | 6,842 | 13.8% |
[ 7.0% - 7.5% ] 7.28% | 6,343 | 12.9% |
[ 7.0% - 7.5% ] 7.45% | 2,712 | 20.7% |
[ 7.5% - 8.0% ] 7.65% | 3,711 | 26.2% |
[ 7.5% - 8.0% ] 7.94% | 2,014 | 16.5% |
[ 8.0% - 8.5% ] 8.03% | 7,300 | 10.2% |
[ 8.0% - 8.5% ] 8.18% | 1,394 | 14.6% |
[ 8.0% - 8.5% ] 8.46% | 7,353 | 7.8% |
[ 8.5% - 9.0% ] 8.62% | 441 | 18.5% |
[ 8.5% - 9.0% ] 8.82% | 13,542 | 16.4% |
[ 9.0% - 9.5% ] 9.08% | 3,834 | 6.5% |
[ 9.0% - 9.5% ] 9.24% | 12,486 | 13.1% |
[ 9.0% - 9.5% ] 9.44% | 1,028 | 12.9% |
[ 9.5% - 10.0% ] 9.50% | 28,566 | 10.3% |
[ 9.5% - 10.0% ] 9.79% | 388 | 11.2% |
[ 9.5% - 10.0% ] 9.90% | 22,551 | 13.4% |
[ 10.0% - 10.5% ] 10.14% | 345 | 4.7% |
[ 10.5% - 11.0% ] 10.56% | 161 | 37.4% |
[ 10.5% - 11.0% ] 10.68% | 103 | 4.9% |
[ 10.5% - 11.0% ] 10.82% | 3,411 | 13.9% |
[ 11.0% - 11.5% ] 11.19% | 447 | 33.1% |
[ 11.0% - 11.5% ] 11.26% | 3,243 | 13.3% |
[ 11.5% - 12.0% ] 11.88% | 202 | 31.0% |
[ 12.0% - 12.5% ] 12.19% | 886 | 15.8% |
[ 12.0% - 12.5% ] 12.40% | 1,572 | 11.6% |
[ 12.5% - 13.0% ] 12.54% | 295 | 23.4% |
[ 12.5% - 13.0% ] 12.78% | 1,409 | 24.4% |
[ 12.5% - 13.0% ] 12.94% | 85 | 22.7% |
[ 13.5% - 14.0% ] 13.71% | 875 | 12.6% |
[ 14.0% - 14.5% ] 14.29% | 161 | 25.4% |
[ 14.0% - 14.5% ] 14.46% | 1,514 | 14.3% |
[ 15.5% - 16.0% ] 15.53% | 1,668 | 12.5% |
[ 15.5% - 16.0% ] 15.60% | 327 | 64.3% |
[ 16.0% - 16.5% ] 16.04% | 804 | 26.9% |
[ 16.0% - 16.5% ] 16.24% | 234 | 50.7% |
[ 16.5% - 17.0% ] 16.70% | 1,383 | 9.9% |
[ 17.5% - 18.0% ] 17.54% | 57 | 40.0% |
[ 17.5% - 18.0% ] 17.86% | 308 | 30.9% |
[ 18.0% - 18.5% ] 18.18% | 44 | 13.3% |
[ 19.5% - 20.0% ] 19.87% | 1,052 | 16.5% |
[ 20.0% - 20.5% ] 20.00% | 40 | 4.5% |
[ 20.5% - 21.0% ] 20.79% | 433 | 68.7% |
[ 21.0% - 21.5% ] 21.46% | 494 | 25.0% |
[ 21.5% - 22.0% ] 21.99% | 141 | 49.4% |
[ 22.5% - 23.0% ] 22.52% | 595 | 20.9% |
[ 23.5% - 24.0% ] 23.64% | 110 | 29.9% |
[ 24.5% - 25.0% ] 24.52% | 310 | 51.0% |
[ 25.5% - 26.0% ] 25.60% | 250 | 25.9% |
[ 26.5% - 27.0% ] 26.55% | 531 | 28.5% |
[ 26.5% - 27.0% ] 26.81% | 235 | 14.2% |
[ 27.0% - 27.5% ] 27.32% | 205 | 20.3% |
[ 30.5% - 31.0% ] 30.84% | 467 | 4.7% |
[ 32.5% - 33.0% ] 32.54% | 209 | 24.3% |
[ 34.5% - 35.0% ] 34.95% | 206 | 60.9% |