Lithuanian Wage/Income Gap
COMPARE
Lithuanian
Select to Compare
Wage/Income Gap
Lithuanian Wage/Income Gap
28.7%
WAGE/INCOME GAP
0.1/ 100
METRIC RATING
316th/ 347
METRIC RANK
Lithuanian Wage/Income Gap Correlation Chart
The statistical analysis conducted on geographies consisting of 421,511,979 people shows a poor positive correlation between the proportion of Lithuanians and wage/income gap percentage in the United States with a correlation coefficient (R) of 0.121 and weighted average of 28.7%. On average, for every 1% (one percent) increase in Lithuanians within a typical geography, there is an increase of 0.24% in wage/income gap percentage.
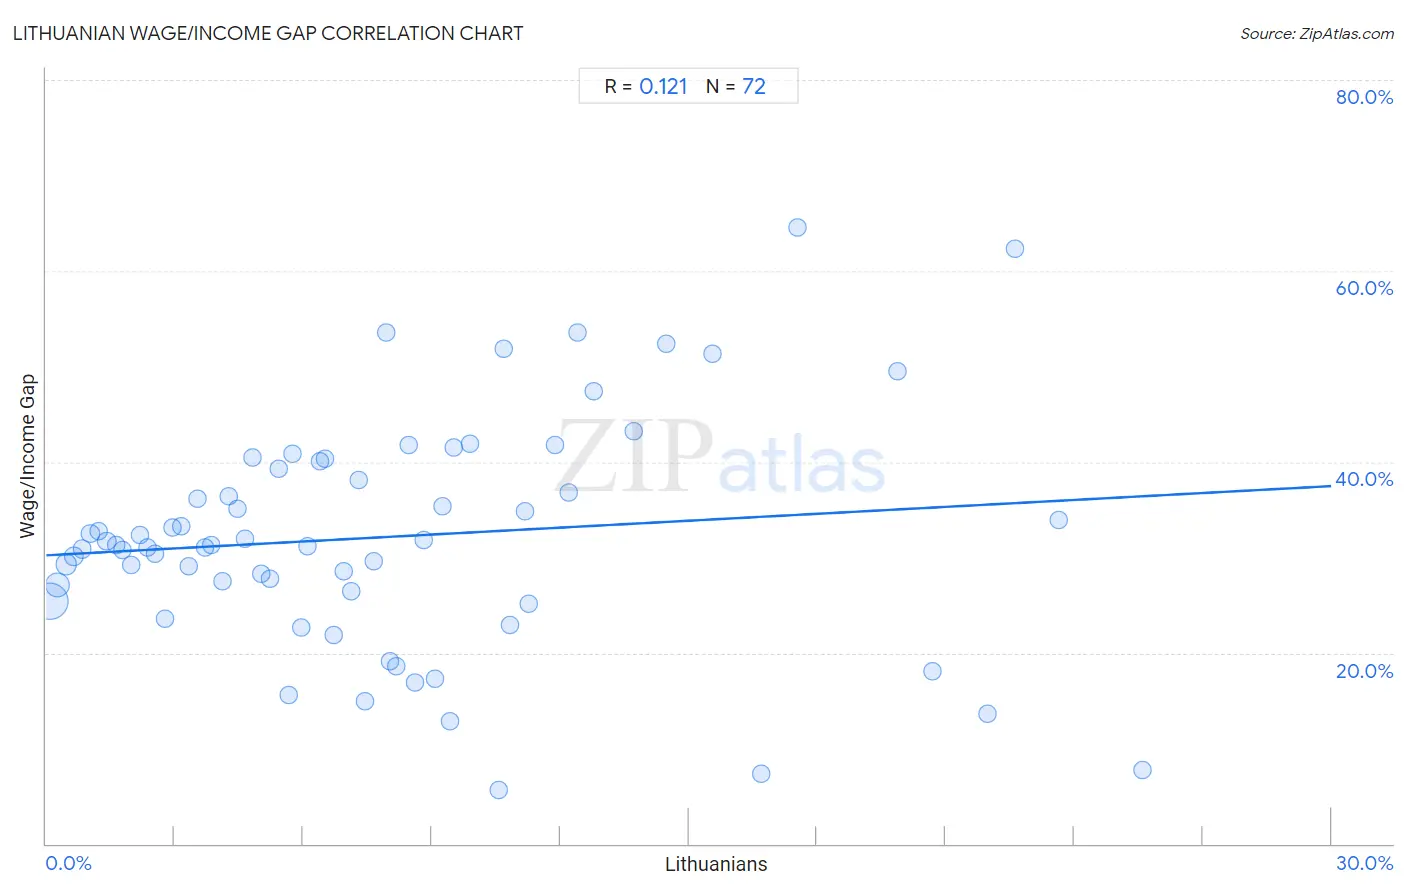
It is essential to understand that the correlation between the percentage of Lithuanians and wage/income gap percentage does not imply a direct cause-and-effect relationship. It remains uncertain whether the presence of Lithuanians influences an upward or downward trend in the level of wage/income gap percentage within an area, or if Lithuanians simply ended up residing in those areas with higher or lower levels of wage/income gap percentage due to other factors.
Demographics Similar to Lithuanians by Wage/Income Gap
In terms of wage/income gap, the demographic groups most similar to Lithuanians are Maltese (28.7%, a difference of 0.010%), Immigrants from Scotland (28.7%, a difference of 0.060%), Belgian (28.8%, a difference of 0.11%), Basque (28.8%, a difference of 0.16%), and French (28.7%, a difference of 0.20%).
| Demographics | Rating | Rank | Wage/Income Gap |
| Macedonians | 0.1 /100 | #309 | Tragic 28.6% |
| Finns | 0.1 /100 | #310 | Tragic 28.6% |
| Immigrants from Lithuania | 0.1 /100 | #311 | Tragic 28.6% |
| Eastern Europeans | 0.1 /100 | #312 | Tragic 28.6% |
| French | 0.1 /100 | #313 | Tragic 28.7% |
| Immigrants from Scotland | 0.1 /100 | #314 | Tragic 28.7% |
| Maltese | 0.1 /100 | #315 | Tragic 28.7% |
| Lithuanians | 0.1 /100 | #316 | Tragic 28.7% |
| Belgians | 0.1 /100 | #317 | Tragic 28.8% |
| Basques | 0.1 /100 | #318 | Tragic 28.8% |
| Slovaks | 0.1 /100 | #319 | Tragic 28.9% |
| British | 0.1 /100 | #320 | Tragic 28.9% |
| Welsh | 0.1 /100 | #321 | Tragic 28.9% |
| Immigrants from Singapore | 0.1 /100 | #322 | Tragic 28.9% |
| Norwegians | 0.1 /100 | #323 | Tragic 29.0% |
Lithuanian Wage/Income Gap Correlation Summary
| Measurement | Lithuanian Data | Wage/Income Gap Data |
| Minimum | 0.087% | 5.6% |
| Maximum | 25.6% | 64.5% |
| Range | 25.5% | 58.9% |
| Mean | 8.0% | 32.1% |
| Median | 6.8% | 31.3% |
| Interquartile 25% (IQ1) | 3.4% | 25.9% |
| Interquartile 75% (IQ3) | 10.7% | 39.7% |
| Interquartile Range (IQR) | 7.3% | 13.8% |
| Standard Deviation (Sample) | 6.0% | 12.1% |
| Standard Deviation (Population) | 6.0% | 12.0% |
Correlation Details
| Lithuanian Percentile | Sample Size | Wage/Income Gap |
[ 0.0% - 0.5% ] 0.087% | 258,926,812 | 25.4% |
[ 0.0% - 0.5% ] 0.27% | 88,688,663 | 27.1% |
[ 0.0% - 0.5% ] 0.46% | 35,409,457 | 29.3% |
[ 0.5% - 1.0% ] 0.65% | 14,681,959 | 30.2% |
[ 0.5% - 1.0% ] 0.84% | 8,263,375 | 30.8% |
[ 1.0% - 1.5% ] 1.03% | 5,328,446 | 32.5% |
[ 1.0% - 1.5% ] 1.23% | 2,636,692 | 32.8% |
[ 1.0% - 1.5% ] 1.41% | 1,803,812 | 31.7% |
[ 1.5% - 2.0% ] 1.62% | 1,192,997 | 31.3% |
[ 1.5% - 2.0% ] 1.79% | 1,027,450 | 30.8% |
[ 1.5% - 2.0% ] 1.99% | 734,398 | 29.2% |
[ 2.0% - 2.5% ] 2.19% | 675,230 | 32.3% |
[ 2.0% - 2.5% ] 2.37% | 531,214 | 31.1% |
[ 2.5% - 3.0% ] 2.53% | 311,958 | 30.4% |
[ 2.5% - 3.0% ] 2.76% | 273,081 | 23.5% |
[ 2.5% - 3.0% ] 2.93% | 85,771 | 33.2% |
[ 3.0% - 3.5% ] 3.16% | 80,852 | 33.2% |
[ 3.0% - 3.5% ] 3.32% | 90,774 | 29.0% |
[ 3.5% - 4.0% ] 3.52% | 133,763 | 36.1% |
[ 3.5% - 4.0% ] 3.70% | 55,323 | 31.0% |
[ 3.5% - 4.0% ] 3.87% | 23,745 | 31.4% |
[ 4.0% - 4.5% ] 4.13% | 76,580 | 27.5% |
[ 4.0% - 4.5% ] 4.27% | 82,101 | 36.4% |
[ 4.0% - 4.5% ] 4.46% | 39,478 | 35.1% |
[ 4.5% - 5.0% ] 4.63% | 48,842 | 32.0% |
[ 4.5% - 5.0% ] 4.81% | 14,523 | 40.5% |
[ 5.0% - 5.5% ] 5.01% | 71,865 | 28.3% |
[ 5.0% - 5.5% ] 5.23% | 17,435 | 27.7% |
[ 5.0% - 5.5% ] 5.44% | 6,765 | 39.3% |
[ 5.5% - 6.0% ] 5.66% | 5,496 | 15.5% |
[ 5.5% - 6.0% ] 5.75% | 8,499 | 40.8% |
[ 5.5% - 6.0% ] 5.95% | 20,281 | 22.6% |
[ 6.0% - 6.5% ] 6.09% | 5,877 | 31.2% |
[ 6.0% - 6.5% ] 6.38% | 10,735 | 40.0% |
[ 6.5% - 7.0% ] 6.51% | 9,308 | 40.3% |
[ 6.5% - 7.0% ] 6.71% | 3,308 | 21.9% |
[ 6.5% - 7.0% ] 6.94% | 2,191 | 28.5% |
[ 7.0% - 7.5% ] 7.12% | 5,898 | 26.5% |
[ 7.0% - 7.5% ] 7.29% | 5,916 | 38.1% |
[ 7.0% - 7.5% ] 7.45% | 2,712 | 14.9% |
[ 7.5% - 8.0% ] 7.66% | 3,329 | 29.6% |
[ 7.5% - 8.0% ] 7.95% | 478 | 53.6% |
[ 8.0% - 8.5% ] 8.02% | 5,862 | 19.1% |
[ 8.0% - 8.5% ] 8.17% | 1,334 | 18.6% |
[ 8.0% - 8.5% ] 8.46% | 7,353 | 41.8% |
[ 8.5% - 9.0% ] 8.62% | 441 | 16.9% |
[ 8.5% - 9.0% ] 8.82% | 12,683 | 31.8% |
[ 9.0% - 9.5% ] 9.08% | 3,138 | 17.3% |
[ 9.0% - 9.5% ] 9.24% | 12,486 | 35.3% |
[ 9.0% - 9.5% ] 9.43% | 732 | 12.8% |
[ 9.5% - 10.0% ] 9.50% | 29,267 | 41.5% |
[ 9.5% - 10.0% ] 9.90% | 22,551 | 41.8% |
[ 10.5% - 11.0% ] 10.56% | 161 | 5.6% |
[ 10.5% - 11.0% ] 10.68% | 103 | 51.9% |
[ 10.5% - 11.0% ] 10.82% | 3,411 | 23.0% |
[ 11.0% - 11.5% ] 11.19% | 447 | 34.8% |
[ 11.0% - 11.5% ] 11.26% | 2,940 | 25.2% |
[ 11.5% - 12.0% ] 11.89% | 143 | 41.7% |
[ 12.0% - 12.5% ] 12.19% | 886 | 36.8% |
[ 12.0% - 12.5% ] 12.40% | 1,572 | 53.6% |
[ 12.5% - 13.0% ] 12.78% | 1,409 | 47.4% |
[ 13.5% - 14.0% ] 13.71% | 875 | 43.2% |
[ 14.0% - 14.5% ] 14.46% | 1,514 | 52.4% |
[ 15.5% - 16.0% ] 15.54% | 1,454 | 51.3% |
[ 16.5% - 17.0% ] 16.70% | 1,383 | 7.4% |
[ 17.5% - 18.0% ] 17.54% | 57 | 64.5% |
[ 19.5% - 20.0% ] 19.87% | 1,052 | 49.5% |
[ 20.5% - 21.0% ] 20.69% | 145 | 18.0% |
[ 21.5% - 22.0% ] 21.99% | 141 | 13.6% |
[ 22.5% - 23.0% ] 22.61% | 690 | 62.3% |
[ 23.5% - 24.0% ] 23.64% | 110 | 33.9% |
[ 25.5% - 26.0% ] 25.60% | 250 | 7.7% |