Lithuanian College, Under 1 year
COMPARE
Lithuanian
Select to Compare
College, Under 1 year
Lithuanian College, Under 1 year
68.8%
COLLEGE, UNDER 1 YEAR
99.1/ 100
METRIC RATING
70th/ 347
METRIC RANK
Lithuanian College, Under 1 year Correlation Chart
The statistical analysis conducted on geographies consisting of 421,945,677 people shows a weak negative correlation between the proportion of Lithuanians and percentage of population with at least college, under 1 year education in the United States with a correlation coefficient (R) of -0.285 and weighted average of 68.8%. On average, for every 1% (one percent) increase in Lithuanians within a typical geography, there is a decrease of 0.52% in percentage of population with at least college, under 1 year education.
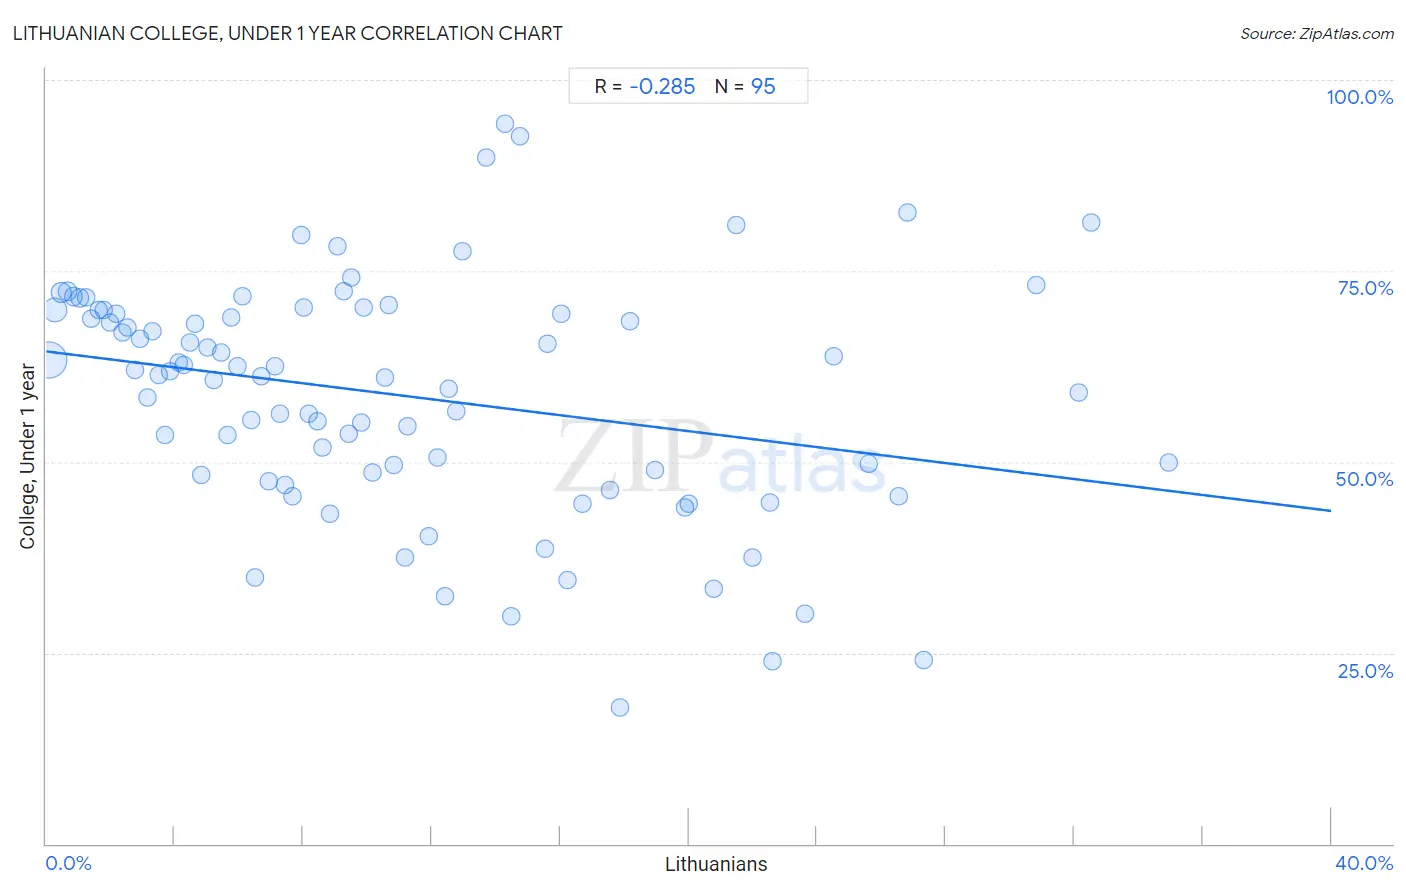
It is essential to understand that the correlation between the percentage of Lithuanians and percentage of population with at least college, under 1 year education does not imply a direct cause-and-effect relationship. It remains uncertain whether the presence of Lithuanians influences an upward or downward trend in the level of percentage of population with at least college, under 1 year education within an area, or if Lithuanians simply ended up residing in those areas with higher or lower levels of percentage of population with at least college, under 1 year education due to other factors.
Demographics Similar to Lithuanians by College, Under 1 year
In terms of college, under 1 year, the demographic groups most similar to Lithuanians are Immigrants from Europe (68.8%, a difference of 0.010%), Bolivian (68.7%, a difference of 0.060%), Immigrants from England (68.7%, a difference of 0.090%), Swedish (68.7%, a difference of 0.15%), and Immigrants from Romania (68.9%, a difference of 0.16%).
| Demographics | Rating | Rank | College, Under 1 year |
| Immigrants from Canada | 99.4 /100 | #63 | Exceptional 69.1% |
| Northern Europeans | 99.4 /100 | #64 | Exceptional 69.0% |
| Immigrants from Moldova | 99.3 /100 | #65 | Exceptional 69.0% |
| Immigrants from North America | 99.3 /100 | #66 | Exceptional 69.0% |
| Immigrants from Zimbabwe | 99.2 /100 | #67 | Exceptional 68.9% |
| Immigrants from Indonesia | 99.2 /100 | #68 | Exceptional 68.9% |
| Immigrants from Romania | 99.2 /100 | #69 | Exceptional 68.9% |
| Lithuanians | 99.1 /100 | #70 | Exceptional 68.8% |
| Immigrants from Europe | 99.1 /100 | #71 | Exceptional 68.8% |
| Bolivians | 99.0 /100 | #72 | Exceptional 68.7% |
| Immigrants from England | 99.0 /100 | #73 | Exceptional 68.7% |
| Swedes | 98.9 /100 | #74 | Exceptional 68.7% |
| Immigrants from Western Europe | 98.6 /100 | #75 | Exceptional 68.5% |
| Laotians | 98.6 /100 | #76 | Exceptional 68.5% |
| British | 98.6 /100 | #77 | Exceptional 68.5% |
Lithuanian College, Under 1 year Correlation Summary
| Measurement | Lithuanian Data | College, Under 1 year Data |
| Minimum | 0.087% | 17.9% |
| Maximum | 35.0% | 94.2% |
| Range | 34.9% | 76.4% |
| Mean | 11.0% | 58.7% |
| Median | 9.1% | 61.4% |
| Interquartile 25% (IQ1) | 4.5% | 48.2% |
| Interquartile 75% (IQ3) | 16.0% | 69.9% |
| Interquartile Range (IQR) | 11.6% | 21.6% |
| Standard Deviation (Sample) | 8.4% | 15.4% |
| Standard Deviation (Population) | 8.4% | 15.4% |
Correlation Details
| Lithuanian Percentile | Sample Size | College, Under 1 year |
[ 0.0% - 0.5% ] 0.087% | 258,988,312 | 63.3% |
[ 0.0% - 0.5% ] 0.27% | 88,756,829 | 70.0% |
[ 0.0% - 0.5% ] 0.46% | 35,463,020 | 72.2% |
[ 0.5% - 1.0% ] 0.65% | 14,719,799 | 72.4% |
[ 0.5% - 1.0% ] 0.84% | 8,293,502 | 71.6% |
[ 1.0% - 1.5% ] 1.03% | 5,352,117 | 71.5% |
[ 1.0% - 1.5% ] 1.23% | 2,660,759 | 71.5% |
[ 1.0% - 1.5% ] 1.41% | 1,823,344 | 68.8% |
[ 1.5% - 2.0% ] 1.62% | 1,208,677 | 69.9% |
[ 1.5% - 2.0% ] 1.79% | 1,041,540 | 69.9% |
[ 1.5% - 2.0% ] 1.99% | 742,160 | 68.2% |
[ 2.0% - 2.5% ] 2.19% | 683,876 | 69.4% |
[ 2.0% - 2.5% ] 2.37% | 533,397 | 67.0% |
[ 2.5% - 3.0% ] 2.53% | 315,300 | 67.6% |
[ 2.5% - 3.0% ] 2.76% | 281,005 | 62.0% |
[ 2.5% - 3.0% ] 2.93% | 90,345 | 66.1% |
[ 3.0% - 3.5% ] 3.16% | 83,779 | 58.5% |
[ 3.0% - 3.5% ] 3.32% | 97,616 | 67.2% |
[ 3.5% - 4.0% ] 3.52% | 136,192 | 61.4% |
[ 3.5% - 4.0% ] 3.70% | 57,190 | 53.6% |
[ 3.5% - 4.0% ] 3.87% | 25,329 | 61.8% |
[ 4.0% - 4.5% ] 4.12% | 79,734 | 63.1% |
[ 4.0% - 4.5% ] 4.27% | 82,752 | 62.7% |
[ 4.0% - 4.5% ] 4.46% | 40,826 | 65.7% |
[ 4.5% - 5.0% ] 4.63% | 50,106 | 68.1% |
[ 4.5% - 5.0% ] 4.81% | 16,701 | 48.2% |
[ 5.0% - 5.5% ] 5.01% | 73,509 | 64.9% |
[ 5.0% - 5.5% ] 5.23% | 18,791 | 60.7% |
[ 5.0% - 5.5% ] 5.44% | 8,056 | 64.3% |
[ 5.5% - 6.0% ] 5.64% | 7,585 | 53.5% |
[ 5.5% - 6.0% ] 5.76% | 9,289 | 68.9% |
[ 5.5% - 6.0% ] 5.95% | 23,690 | 62.4% |
[ 6.0% - 6.5% ] 6.09% | 5,877 | 71.7% |
[ 6.0% - 6.5% ] 6.38% | 10,735 | 55.5% |
[ 6.5% - 7.0% ] 6.51% | 10,238 | 34.8% |
[ 6.5% - 7.0% ] 6.71% | 3,397 | 61.3% |
[ 6.5% - 7.0% ] 6.94% | 2,191 | 47.5% |
[ 7.0% - 7.5% ] 7.12% | 7,081 | 62.5% |
[ 7.0% - 7.5% ] 7.28% | 6,466 | 56.3% |
[ 7.0% - 7.5% ] 7.45% | 2,712 | 46.9% |
[ 7.5% - 8.0% ] 7.65% | 3,907 | 45.5% |
[ 7.5% - 8.0% ] 7.94% | 2,014 | 79.7% |
[ 8.0% - 8.5% ] 8.03% | 7,300 | 70.2% |
[ 8.0% - 8.5% ] 8.18% | 1,394 | 56.3% |
[ 8.0% - 8.5% ] 8.46% | 7,353 | 55.2% |
[ 8.5% - 9.0% ] 8.62% | 441 | 51.8% |
[ 8.5% - 9.0% ] 8.82% | 13,542 | 43.2% |
[ 9.0% - 9.5% ] 9.08% | 3,834 | 78.3% |
[ 9.0% - 9.5% ] 9.24% | 12,486 | 72.3% |
[ 9.0% - 9.5% ] 9.44% | 1,028 | 53.7% |
[ 9.5% - 10.0% ] 9.50% | 29,288 | 74.1% |
[ 9.5% - 10.0% ] 9.79% | 388 | 55.1% |
[ 9.5% - 10.0% ] 9.90% | 22,551 | 70.2% |
[ 10.0% - 10.5% ] 10.14% | 345 | 48.5% |
[ 10.5% - 11.0% ] 10.56% | 161 | 61.0% |
[ 10.5% - 11.0% ] 10.68% | 103 | 70.5% |
[ 10.5% - 11.0% ] 10.82% | 3,411 | 49.5% |
[ 11.0% - 11.5% ] 11.19% | 447 | 37.4% |
[ 11.0% - 11.5% ] 11.26% | 3,243 | 54.7% |
[ 11.5% - 12.0% ] 11.90% | 420 | 40.3% |
[ 12.0% - 12.5% ] 12.19% | 886 | 50.6% |
[ 12.0% - 12.5% ] 12.40% | 1,572 | 32.4% |
[ 12.5% - 13.0% ] 12.54% | 295 | 59.6% |
[ 12.5% - 13.0% ] 12.78% | 1,409 | 56.6% |
[ 12.5% - 13.0% ] 12.94% | 85 | 77.6% |
[ 13.5% - 14.0% ] 13.71% | 875 | 89.9% |
[ 14.0% - 14.5% ] 14.29% | 231 | 94.2% |
[ 14.0% - 14.5% ] 14.46% | 1,514 | 29.9% |
[ 14.5% - 15.0% ] 14.74% | 95 | 92.6% |
[ 15.5% - 16.0% ] 15.53% | 1,668 | 38.7% |
[ 15.5% - 16.0% ] 15.60% | 327 | 65.5% |
[ 16.0% - 16.5% ] 16.04% | 804 | 69.4% |
[ 16.0% - 16.5% ] 16.24% | 234 | 34.5% |
[ 16.5% - 17.0% ] 16.70% | 1,383 | 44.5% |
[ 17.5% - 18.0% ] 17.54% | 57 | 46.3% |
[ 17.5% - 18.0% ] 17.86% | 308 | 17.9% |
[ 18.0% - 18.5% ] 18.18% | 44 | 68.4% |
[ 18.5% - 19.0% ] 18.97% | 116 | 49.0% |
[ 19.5% - 20.0% ] 19.87% | 1,052 | 44.0% |
[ 20.0% - 20.5% ] 20.00% | 40 | 44.4% |
[ 20.5% - 21.0% ] 20.79% | 433 | 33.4% |
[ 21.0% - 21.5% ] 21.47% | 652 | 81.1% |
[ 21.5% - 22.0% ] 21.99% | 141 | 37.4% |
[ 22.5% - 23.0% ] 22.52% | 595 | 44.7% |
[ 22.5% - 23.0% ] 22.61% | 690 | 23.9% |
[ 23.5% - 24.0% ] 23.64% | 110 | 30.2% |
[ 24.5% - 25.0% ] 24.52% | 310 | 63.8% |
[ 25.5% - 26.0% ] 25.60% | 250 | 49.7% |
[ 26.5% - 27.0% ] 26.55% | 531 | 45.5% |
[ 26.5% - 27.0% ] 26.81% | 235 | 82.7% |
[ 27.0% - 27.5% ] 27.32% | 205 | 24.1% |
[ 30.5% - 31.0% ] 30.84% | 467 | 73.1% |
[ 32.0% - 32.5% ] 32.14% | 168 | 59.0% |
[ 32.5% - 33.0% ] 32.54% | 209 | 81.3% |
[ 34.5% - 35.0% ] 34.95% | 206 | 50.0% |