Latvian 4 or more Vehicles in Household

COMPARE

Latvian
Race
Ancestry
AfghanAfricanAlaska NativeAlaskan AthabascanAlbanianAleutAlsatianAmericanApacheArabArapahoArgentineanArmenianAssyrian/Chaldean/SyriacAustralianAustrianBahamianBangladeshiBarbadianBasqueBelgianBelizeanBermudanBhutaneseBlackfeetBolivianBrazilianBritishBritish West IndianBulgarianBurmeseCajunCambodianCanadianCape VerdeanCarpatho RusynCelticCentral AmericanCentral American IndianCherokeeCheyenneChickasawChileanChineseChippewaChoctawColombianColvilleComancheCosta RicanCreeCreekCroatianCrowCubanCypriotCzechCzechoslovakianDanishDelawareDominicanDutchDutch West IndianEastern EuropeanEcuadorianEgyptianEnglishEstonianEthiopianEuropeanFijianFilipinoFinnishFrenchFrench American IndianFrench CanadianGermanGerman RussianGhanaianGreekGuamanian/ChamorroGuatemalanGuyaneseHaitianHmongHonduranHopiHoumaHungarianIcelanderIndian (Asian)IndonesianInupiatIranianIraqiIrishIroquoisIsraeliItalianJamaicanJapaneseJordanianKenyanKiowaKoreanLaotianLatvianLebaneseLiberianLithuanianLumbeeLuxembourgerMacedonianMalaysianMalteseMarshalleseMenomineeMexicanMexican American IndianMongolianMoroccanNative HawaiianNavajoNepaleseNew ZealanderNicaraguanNigerianNorthern EuropeanNorwegianOkinawanOsageOttawaPaiutePakistaniPalestinianPanamanianParaguayanPennsylvania GermanPeruvianPimaPolishPortuguesePotawatomiPuebloPuerto RicanPuget Sound SalishRomanianRussianSalvadoranSamoanScandinavianScotch-IrishScottishSeminoleSenegaleseSerbianShoshoneSierra LeoneanSiouxSlavicSlovakSloveneSomaliSouth AfricanSouth AmericanSouth American IndianSoviet UnionSpaniardSpanishSpanish AmericanSpanish American IndianSri LankanSubsaharan AfricanSudaneseSwedishSwissSyrianTaiwaneseThaiTlingit-HaidaTohono O'OdhamTonganTrinidadian and TobagonianTsimshianTurkishU.S. Virgin IslanderUgandanUkrainianUruguayanUteVenezuelanVietnameseWelshWest IndianYakamaYaquiYugoslavianYumanYup'ikZimbabwean
Immigration
NonimmigrantsImmigrantsAfghanistanAfricaAlbaniaArgentinaArmeniaAsiaAustraliaAustriaBahamasBangladeshBarbadosBelarusBelgiumBelizeBoliviaBosnia and HerzegovinaBrazilBulgariaBurma/MyanmarCabo VerdeCambodiaCameroonCanadaCaribbeanCentral AmericaChileChinaColombiaCongoCosta RicaCroatiaCubaCzechoslovakiaDenmarkDominicaDominican RepublicEastern AfricaEastern AsiaEastern EuropeEcuadorEgyptEl SalvadorEnglandEritreaEthiopiaEuropeFijiFranceGermanyGhanaGreeceGrenadaGuatemalaGuyanaHaitiHondurasHong KongHungaryIndiaIndonesiaIranIraqIrelandIsraelItalyJamaicaJapanJordanKazakhstanKenyaKoreaKuwaitLaosLatin AmericaLatviaLebanonLiberiaLithuaniaMalaysiaMexicoMicronesiaMiddle AfricaMoldovaMoroccoNepalNetherlandsNicaraguaNigeriaNorth AmericaNorth MacedoniaNorthern AfricaNorthern EuropeNorwayOceaniaPakistanPanamaPeruPhilippinesPolandPortugalRomaniaRussiaSaudi ArabiaScotlandSenegalSerbiaSierra LeoneSingaporeSomaliaSouth AfricaSouth AmericaSouth Central AsiaSouth Eastern AsiaSouthern EuropeSpainSri LankaSt. Vincent and the GrenadinesSudanSwedenSwitzerlandSyriaTaiwanThailandTrinidad and TobagoTurkeyUgandaUkraineUruguayUzbekistanVenezuelaVietnamWest IndiesWestern AfricaWestern AsiaWestern EuropeYemenZaireZimbabweAzores
Select to Compare
Race
Ancestry
AfghanAfricanAlaska NativeAlaskan AthabascanAlbanianAleutAlsatianAmericanApacheArabArapahoArgentineanArmenianAssyrian/Chaldean/SyriacAustralianAustrianBahamianBangladeshiBarbadianBasqueBelgianBelizeanBermudanBhutaneseBlackfeetBolivianBrazilianBritishBritish West IndianBulgarianBurmeseCajunCambodianCanadianCape VerdeanCarpatho RusynCelticCentral AmericanCentral American IndianCherokeeCheyenneChickasawChileanChineseChippewaChoctawColombianColvilleComancheCosta RicanCreeCreekCroatianCrowCubanCypriotCzechCzechoslovakianDanishDelawareDominicanDutchDutch West IndianEastern EuropeanEcuadorianEgyptianEnglishEstonianEthiopianEuropeanFijianFilipinoFinnishFrenchFrench American IndianFrench CanadianGermanGerman RussianGhanaianGreekGuamanian/ChamorroGuatemalanGuyaneseHaitianHmongHonduranHopiHoumaHungarianIcelanderIndian (Asian)IndonesianInupiatIranianIraqiIrishIroquoisIsraeliItalianJamaicanJapaneseJordanianKenyanKiowaKoreanLaotianLebaneseLiberianLithuanianLumbeeLuxembourgerMacedonianMalaysianMalteseMarshalleseMenomineeMexicanMexican American IndianMongolianMoroccanNative HawaiianNavajoNepaleseNew ZealanderNicaraguanNigerianNorthern EuropeanNorwegianOkinawanOsageOttawaPaiutePakistaniPalestinianPanamanianParaguayanPennsylvania GermanPeruvianPimaPolishPortuguesePotawatomiPuebloPuerto RicanPuget Sound SalishRomanianRussianSalvadoranSamoanScandinavianScotch-IrishScottishSeminoleSenegaleseSerbianShoshoneSierra LeoneanSiouxSlavicSlovakSloveneSomaliSouth AfricanSouth AmericanSouth American IndianSoviet UnionSpaniardSpanishSpanish AmericanSpanish American IndianSri LankanSubsaharan AfricanSudaneseSwedishSwissSyrianTaiwaneseThaiTlingit-HaidaTohono O'OdhamTonganTrinidadian and TobagonianTsimshianTurkishU.S. Virgin IslanderUgandanUkrainianUruguayanUteVenezuelanVietnameseWelshWest IndianYakamaYaquiYugoslavianYumanYup'ikZimbabwean
Immigration
NonimmigrantsImmigrantsAfghanistanAfricaAlbaniaArgentinaArmeniaAsiaAustraliaAustriaBahamasBangladeshBarbadosBelarusBelgiumBelizeBoliviaBosnia and HerzegovinaBrazilBulgariaBurma/MyanmarCabo VerdeCambodiaCameroonCanadaCaribbeanCentral AmericaChileChinaColombiaCongoCosta RicaCroatiaCubaCzechoslovakiaDenmarkDominicaDominican RepublicEastern AfricaEastern AsiaEastern EuropeEcuadorEgyptEl SalvadorEnglandEritreaEthiopiaEuropeFijiFranceGermanyGhanaGreeceGrenadaGuatemalaGuyanaHaitiHondurasHong KongHungaryIndiaIndonesiaIranIraqIrelandIsraelItalyJamaicaJapanJordanKazakhstanKenyaKoreaKuwaitLaosLatin AmericaLatviaLebanonLiberiaLithuaniaMalaysiaMexicoMicronesiaMiddle AfricaMoldovaMoroccoNepalNetherlandsNicaraguaNigeriaNorth AmericaNorth MacedoniaNorthern AfricaNorthern EuropeNorwayOceaniaPakistanPanamaPeruPhilippinesPolandPortugalRomaniaRussiaSaudi ArabiaScotlandSenegalSerbiaSierra LeoneSingaporeSomaliaSouth AfricaSouth AmericaSouth Central AsiaSouth Eastern AsiaSouthern EuropeSpainSri LankaSt. Vincent and the GrenadinesSudanSwedenSwitzerlandSyriaTaiwanThailandTrinidad and TobagoTurkeyUgandaUkraineUruguayUzbekistanVenezuelaVietnamWest IndiesWestern AfricaWestern AsiaWestern EuropeYemenZaireZimbabweAzores
4 or more Vehicles in Household
Income
Poverty
Unemployment
Labor Participation
Family Structure
Vehicle Availability
Education Level
Disability

Latvian 4 or more Vehicles in Household
Fair

6.1%
4+ VEHICLES AVAILABLE
21.7/ 100
METRIC RATING
200th/ 347
METRIC RANK

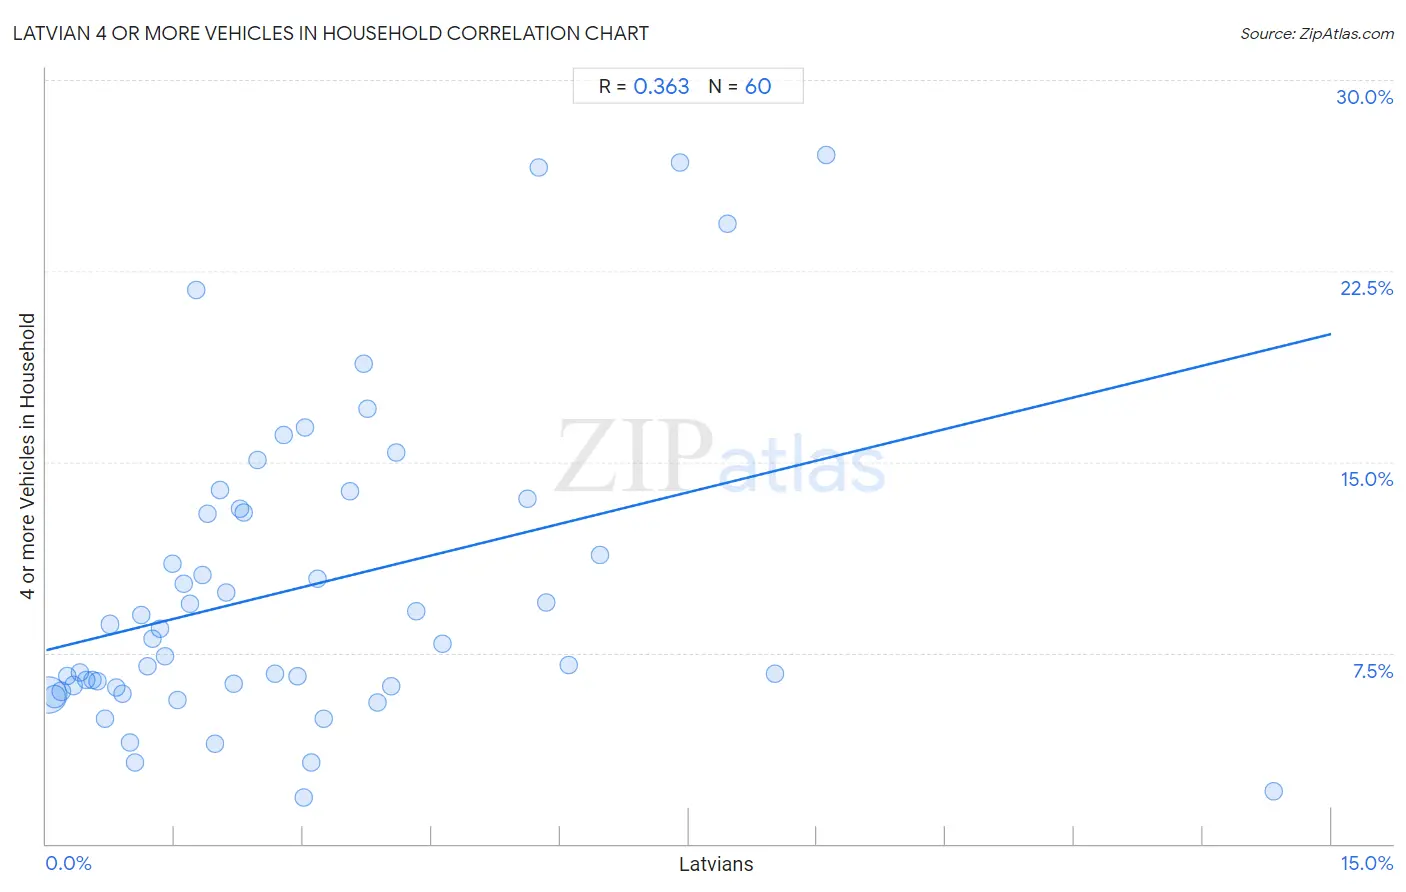
Latvian 4 or more Vehicles in Household Correlation Chart

The statistical analysis conducted on geographies consisting of 219,878,436 people shows a mild positive correlation between the proportion of Latvians and percentage of households with 4 or more vehicles available in the United States with a correlation coefficient (R) of 0.363 and weighted average of 6.1%. On average, for every 1% (one percent) increase in Latvians within a typical geography, there is an increase of 0.83% in percentage of households with 4 or more vehicles available.
Latvian 4 or more Vehicles in Household
It is essential to understand that the correlation between the percentage of Latvians and percentage of households with 4 or more vehicles available does not imply a direct cause-and-effect relationship. It remains uncertain whether the presence of Latvians influences an upward or downward trend in the level of percentage of households with 4 or more vehicles available within an area, or if Latvians simply ended up residing in those areas with higher or lower levels of percentage of households with 4 or more vehicles available due to other factors.

Demographics Similar to Latvians by 4 or more Vehicles in Household

In terms of 4 or more vehicles in household, the demographic groups most similar to Latvians are Immigrants from Norway (6.1%, a difference of 0.0%), Egyptian (6.1%, a difference of 0.050%), Immigrants from South Central Asia (6.1%, a difference of 0.060%), Immigrants from Portugal (6.1%, a difference of 0.090%), and Immigrants from Sierra Leone (6.1%, a difference of 0.20%).
DemographicsRating | Rank4 or more Vehicles in Household
Immigrants from Kuwait
28.0
/100
|
#193
Fair
6.2%
Immigrants from Sweden
27.0
/100
|
#194
Fair
6.2%
Argentineans
27.0
/100
|
#195
Fair
6.2%
Tsimshian
26.4
/100
|
#196
Fair
6.2%
Immigrants from Sri Lanka
23.7
/100
|
#197
Fair
6.1%
Immigrants from Portugal
22.3
/100
|
#198
Fair
6.1%
Immigrants from Norway
21.8
/100
|
#199
Fair
6.1%
Latvians
21.7
/100
|
#200
Fair
6.1%
Egyptians
21.4
/100
|
#201
Fair
6.1%
Immigrants from South Central Asia
21.3
/100
|
#202
Fair
6.1%
Immigrants from Sierra Leone
20.5
/100
|
#203
Fair
6.1%
Immigrants from Belize
19.8
/100
|
#204
Poor
6.1%
Hondurans
19.3
/100
|
#205
Poor
6.1%
Kenyans
18.5
/100
|
#206
Poor
6.1%
Immigrants from Chile
16.9
/100
|
#207
Poor
6.1%

Latvian 4 or more Vehicles in Household Correlation Summary

MeasurementLatvian Data4 or more Vehicles in Household Data
Minimum0.030%1.8%
Maximum14.3%27.1%
Range14.3%25.3%
Mean2.9%10.0%
Median2.1%8.0%
Interquartile 25% (IQ1)1.1%6.2%
Interquartile 75% (IQ3)3.8%13.1%
Interquartile Range (IQR)2.7%6.9%
Standard Deviation (Sample)2.7%6.1%
Standard Deviation (Population)2.6%6.0%

Correlation Details

Latvian PercentileSample Size4 or more Vehicles in Household
[
0.0%
-
0.5%
]
0.030%
161,186,2945.9%
[
0.0%
-
0.5%
]
0.100%
37,361,1675.8%
[
0.0%
-
0.5%
]
0.17%
10,036,6496.0%
[
0.0%
-
0.5%
]
0.25%
4,522,4466.6%
[
0.0%
-
0.5%
]
0.32%
2,633,3326.2%
[
0.0%
-
0.5%
]
0.39%
1,348,0346.7%
[
0.0%
-
0.5%
]
0.47%
571,4506.5%
[
0.5%
-
1.0%
]
0.53%
611,7276.4%
[
0.5%
-
1.0%
]
0.60%
467,6556.4%
[
0.5%
-
1.0%
]
0.68%
282,4884.9%
[
0.5%
-
1.0%
]
0.75%
188,9078.6%
[
0.5%
-
1.0%
]
0.81%
87,2796.1%
[
0.5%
-
1.0%
]
0.89%
116,3415.9%
[
0.5%
-
1.0%
]
0.97%
72,4614.0%
[
1.0%
-
1.5%
]
1.03%
107,0123.2%
[
1.0%
-
1.5%
]
1.11%
10,5079.0%
[
1.0%
-
1.5%
]
1.18%
31,0717.0%
[
1.0%
-
1.5%
]
1.24%
6,4728.0%
[
1.0%
-
1.5%
]
1.33%
20,5768.5%
[
1.0%
-
1.5%
]
1.39%
13,9437.4%
[
1.0%
-
1.5%
]
1.48%
11,49311.0%
[
1.5%
-
2.0%
]
1.53%
47,1365.7%
[
1.5%
-
2.0%
]
1.61%
10,21010.2%
[
1.5%
-
2.0%
]
1.68%
12,5169.4%
[
1.5%
-
2.0%
]
1.75%
4,50221.8%
[
1.5%
-
2.0%
]
1.82%
11,28210.6%
[
1.5%
-
2.0%
]
1.88%
9,43513.0%
[
1.5%
-
2.0%
]
1.98%
13,9733.9%
[
2.0%
-
2.5%
]
2.03%
4,27613.9%
[
2.0%
-
2.5%
]
2.10%
1,8079.9%
[
2.0%
-
2.5%
]
2.19%
20,5296.3%
[
2.0%
-
2.5%
]
2.26%
2,96413.1%
[
2.0%
-
2.5%
]
2.31%
1,86113.0%
[
2.0%
-
2.5%
]
2.46%
1,74515.1%
[
2.5%
-
3.0%
]
2.67%
13,4976.7%
[
2.5%
-
3.0%
]
2.77%
3,57516.1%
[
2.5%
-
3.0%
]
2.94%
2,0106.6%
[
3.0%
-
3.5%
]
3.01%
1331.8%
[
3.0%
-
3.5%
]
3.03%
8,42516.4%
[
3.0%
-
3.5%
]
3.09%
1623.2%
[
3.0%
-
3.5%
]
3.16%
25310.4%
[
3.0%
-
3.5%
]
3.23%
4024.9%
[
3.5%
-
4.0%
]
3.55%
73213.8%
[
3.5%
-
4.0%
]
3.70%
81118.9%
[
3.5%
-
4.0%
]
3.74%
18717.1%
[
3.5%
-
4.0%
]
3.87%
1,4725.5%
[
4.0%
-
4.5%
]
4.03%
2,0366.2%
[
4.0%
-
4.5%
]
4.09%
22015.4%
[
4.0%
-
4.5%
]
4.32%
1,3439.1%
[
4.5%
-
5.0%
]
4.62%
2,1437.9%
[
5.5%
-
6.0%
]
5.62%
4,61113.5%
[
5.5%
-
6.0%
]
5.75%
22626.6%
[
5.5%
-
6.0%
]
5.83%
2239.5%
[
6.0%
-
6.5%
]
6.10%
7717.0%
[
6.0%
-
6.5%
]
6.46%
44911.3%
[
7.0%
-
7.5%
]
7.39%
2,31326.8%
[
7.5%
-
8.0%
]
7.95%
39024.3%
[
8.5%
-
9.0%
]
8.51%
946.7%
[
9.0%
-
9.5%
]
9.11%
42827.1%
[
14.0%
-
14.5%
]
14.32%
1,9902.0%