Latvian College, 1 year or more
COMPARE
Latvian
Select to Compare
College, 1 year or more
Latvian College, 1 year or more
66.1%
COLLEGE, 1 YEAR OR MORE
100.0/ 100
METRIC RATING
26th/ 347
METRIC RANK
Latvian College, 1 year or more Correlation Chart
The statistical analysis conducted on geographies consisting of 220,726,880 people shows a poor negative correlation between the proportion of Latvians and percentage of population with at least college, 1 year or more education in the United States with a correlation coefficient (R) of -0.174 and weighted average of 66.1%. On average, for every 1% (one percent) increase in Latvians within a typical geography, there is a decrease of 0.90% in percentage of population with at least college, 1 year or more education.
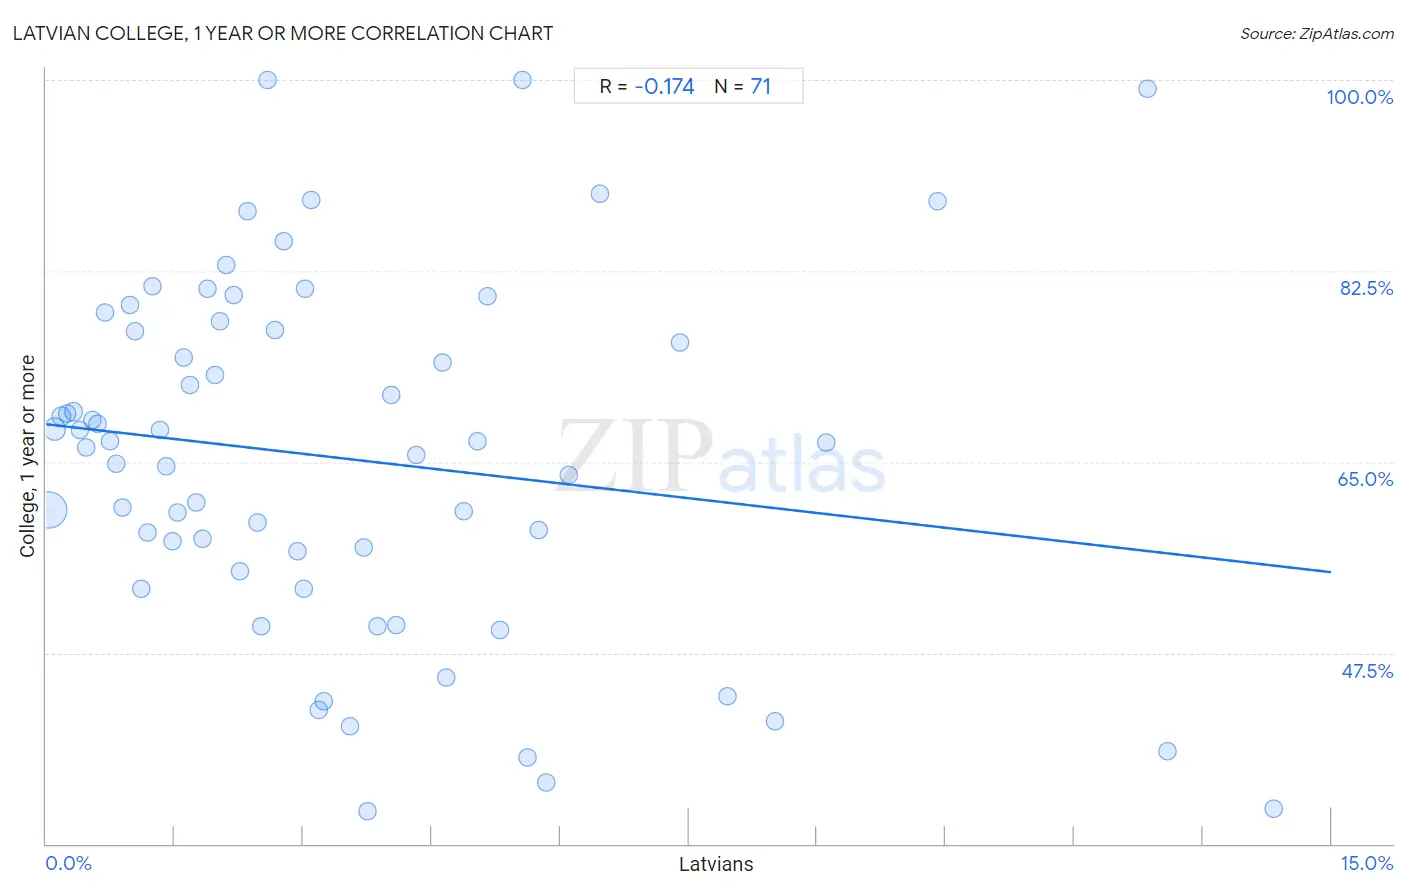
It is essential to understand that the correlation between the percentage of Latvians and percentage of population with at least college, 1 year or more education does not imply a direct cause-and-effect relationship. It remains uncertain whether the presence of Latvians influences an upward or downward trend in the level of percentage of population with at least college, 1 year or more education within an area, or if Latvians simply ended up residing in those areas with higher or lower levels of percentage of population with at least college, 1 year or more education due to other factors.
Demographics Similar to Latvians by College, 1 year or more
In terms of college, 1 year or more, the demographic groups most similar to Latvians are Indian (Asian) (66.1%, a difference of 0.040%), Immigrants from Ireland (65.9%, a difference of 0.20%), Immigrants from France (65.8%, a difference of 0.37%), Immigrants from Belgium (66.3%, a difference of 0.39%), and Immigrants from China (66.4%, a difference of 0.47%).
| Demographics | Rating | Rank | College, 1 year or more |
| Immigrants from Switzerland | 100.0 /100 | #19 | Exceptional 66.5% |
| Immigrants from Korea | 100.0 /100 | #20 | Exceptional 66.5% |
| Immigrants from Hong Kong | 100.0 /100 | #21 | Exceptional 66.4% |
| Soviet Union | 100.0 /100 | #22 | Exceptional 66.4% |
| Immigrants from China | 100.0 /100 | #23 | Exceptional 66.4% |
| Immigrants from Belgium | 100.0 /100 | #24 | Exceptional 66.3% |
| Indians (Asian) | 100.0 /100 | #25 | Exceptional 66.1% |
| Latvians | 100.0 /100 | #26 | Exceptional 66.1% |
| Immigrants from Ireland | 100.0 /100 | #27 | Exceptional 65.9% |
| Immigrants from France | 100.0 /100 | #28 | Exceptional 65.8% |
| Immigrants from Northern Europe | 100.0 /100 | #29 | Exceptional 65.6% |
| Immigrants from Denmark | 100.0 /100 | #30 | Exceptional 65.6% |
| Turks | 100.0 /100 | #31 | Exceptional 65.5% |
| Bulgarians | 100.0 /100 | #32 | Exceptional 65.5% |
| Immigrants from Sri Lanka | 99.9 /100 | #33 | Exceptional 65.4% |
Latvian College, 1 year or more Correlation Summary
| Measurement | Latvian Data | College, 1 year or more Data |
| Minimum | 0.030% | 32.9% |
| Maximum | 14.3% | 100.0% |
| Range | 14.3% | 67.1% |
| Mean | 3.5% | 65.3% |
| Median | 2.6% | 66.8% |
| Interquartile 25% (IQ1) | 1.2% | 54.9% |
| Interquartile 75% (IQ3) | 4.9% | 77.1% |
| Interquartile Range (IQR) | 3.6% | 22.1% |
| Standard Deviation (Sample) | 3.1% | 16.2% |
| Standard Deviation (Population) | 3.1% | 16.1% |
Correlation Details
| Latvian Percentile | Sample Size | College, 1 year or more |
[ 0.0% - 0.5% ] 0.030% | 161,515,841 | 60.6% |
[ 0.0% - 0.5% ] 0.100% | 37,616,099 | 68.0% |
[ 0.0% - 0.5% ] 0.17% | 10,125,212 | 69.2% |
[ 0.0% - 0.5% ] 0.25% | 4,610,996 | 69.5% |
[ 0.0% - 0.5% ] 0.32% | 2,638,204 | 69.6% |
[ 0.0% - 0.5% ] 0.39% | 1,358,630 | 67.9% |
[ 0.0% - 0.5% ] 0.47% | 604,235 | 66.3% |
[ 0.5% - 1.0% ] 0.53% | 614,493 | 68.8% |
[ 0.5% - 1.0% ] 0.60% | 467,655 | 68.4% |
[ 0.5% - 1.0% ] 0.68% | 284,731 | 78.7% |
[ 0.5% - 1.0% ] 0.75% | 192,873 | 66.8% |
[ 0.5% - 1.0% ] 0.81% | 87,279 | 64.8% |
[ 0.5% - 1.0% ] 0.89% | 122,132 | 60.8% |
[ 0.5% - 1.0% ] 0.97% | 76,776 | 79.4% |
[ 1.0% - 1.5% ] 1.03% | 107,968 | 77.0% |
[ 1.0% - 1.5% ] 1.11% | 10,507 | 53.4% |
[ 1.0% - 1.5% ] 1.18% | 31,071 | 58.5% |
[ 1.0% - 1.5% ] 1.24% | 6,472 | 81.1% |
[ 1.0% - 1.5% ] 1.33% | 21,033 | 67.9% |
[ 1.0% - 1.5% ] 1.40% | 20,393 | 64.6% |
[ 1.0% - 1.5% ] 1.48% | 11,493 | 57.7% |
[ 1.5% - 2.0% ] 1.53% | 47,136 | 60.4% |
[ 1.5% - 2.0% ] 1.61% | 10,210 | 74.6% |
[ 1.5% - 2.0% ] 1.68% | 12,516 | 72.1% |
[ 1.5% - 2.0% ] 1.75% | 4,502 | 61.3% |
[ 1.5% - 2.0% ] 1.82% | 11,282 | 57.9% |
[ 1.5% - 2.0% ] 1.88% | 9,435 | 80.9% |
[ 1.5% - 2.0% ] 1.98% | 13,973 | 72.9% |
[ 2.0% - 2.5% ] 2.03% | 4,276 | 77.9% |
[ 2.0% - 2.5% ] 2.10% | 1,807 | 83.1% |
[ 2.0% - 2.5% ] 2.19% | 20,529 | 80.3% |
[ 2.0% - 2.5% ] 2.25% | 3,992 | 54.9% |
[ 2.0% - 2.5% ] 2.35% | 8,050 | 88.0% |
[ 2.0% - 2.5% ] 2.46% | 1,745 | 59.4% |
[ 2.5% - 3.0% ] 2.51% | 1,392 | 49.9% |
[ 2.5% - 3.0% ] 2.58% | 155 | 100.0% |
[ 2.5% - 3.0% ] 2.67% | 13,497 | 77.1% |
[ 2.5% - 3.0% ] 2.77% | 3,575 | 85.3% |
[ 2.5% - 3.0% ] 2.94% | 2,010 | 56.9% |
[ 3.0% - 3.5% ] 3.01% | 133 | 53.4% |
[ 3.0% - 3.5% ] 3.03% | 8,425 | 80.8% |
[ 3.0% - 3.5% ] 3.09% | 162 | 89.0% |
[ 3.0% - 3.5% ] 3.17% | 441 | 42.2% |
[ 3.0% - 3.5% ] 3.23% | 402 | 43.0% |
[ 3.5% - 4.0% ] 3.55% | 732 | 40.8% |
[ 3.5% - 4.0% ] 3.70% | 811 | 57.1% |
[ 3.5% - 4.0% ] 3.74% | 187 | 32.9% |
[ 3.5% - 4.0% ] 3.87% | 1,472 | 49.9% |
[ 4.0% - 4.5% ] 4.03% | 2,036 | 71.2% |
[ 4.0% - 4.5% ] 4.09% | 220 | 50.0% |
[ 4.0% - 4.5% ] 4.32% | 1,343 | 65.6% |
[ 4.5% - 5.0% ] 4.62% | 2,143 | 74.1% |
[ 4.5% - 5.0% ] 4.67% | 300 | 45.2% |
[ 4.5% - 5.0% ] 4.88% | 41 | 60.5% |
[ 5.0% - 5.5% ] 5.03% | 159 | 66.9% |
[ 5.0% - 5.5% ] 5.16% | 349 | 80.1% |
[ 5.0% - 5.5% ] 5.30% | 774 | 49.6% |
[ 5.5% - 6.0% ] 5.56% | 126 | 100.0% |
[ 5.5% - 6.0% ] 5.62% | 4,611 | 37.9% |
[ 5.5% - 6.0% ] 5.75% | 226 | 58.8% |
[ 5.5% - 6.0% ] 5.83% | 223 | 35.6% |
[ 6.0% - 6.5% ] 6.10% | 771 | 63.8% |
[ 6.0% - 6.5% ] 6.46% | 449 | 89.6% |
[ 7.0% - 7.5% ] 7.39% | 2,313 | 76.0% |
[ 7.5% - 8.0% ] 7.95% | 390 | 43.6% |
[ 8.5% - 9.0% ] 8.51% | 94 | 41.2% |
[ 9.0% - 9.5% ] 9.11% | 428 | 66.8% |
[ 10.0% - 10.5% ] 10.41% | 442 | 88.9% |
[ 12.5% - 13.0% ] 12.85% | 428 | 99.2% |
[ 13.0% - 13.5% ] 13.10% | 84 | 38.5% |
[ 14.0% - 14.5% ] 14.32% | 1,990 | 33.2% |