Latvian Disability
COMPARE
Latvian
Select to Compare
Disability
Latvian Disability
11.4%
DISABILITY
89.8/ 100
METRIC RATING
130th/ 347
METRIC RANK
Latvian Disability Correlation Chart
The statistical analysis conducted on geographies consisting of 220,718,032 people shows a substantial positive correlation between the proportion of Latvians and percentage of population with a disability in the United States with a correlation coefficient (R) of 0.518 and weighted average of 11.4%. On average, for every 1% (one percent) increase in Latvians within a typical geography, there is an increase of 1.0% in percentage of population with a disability.
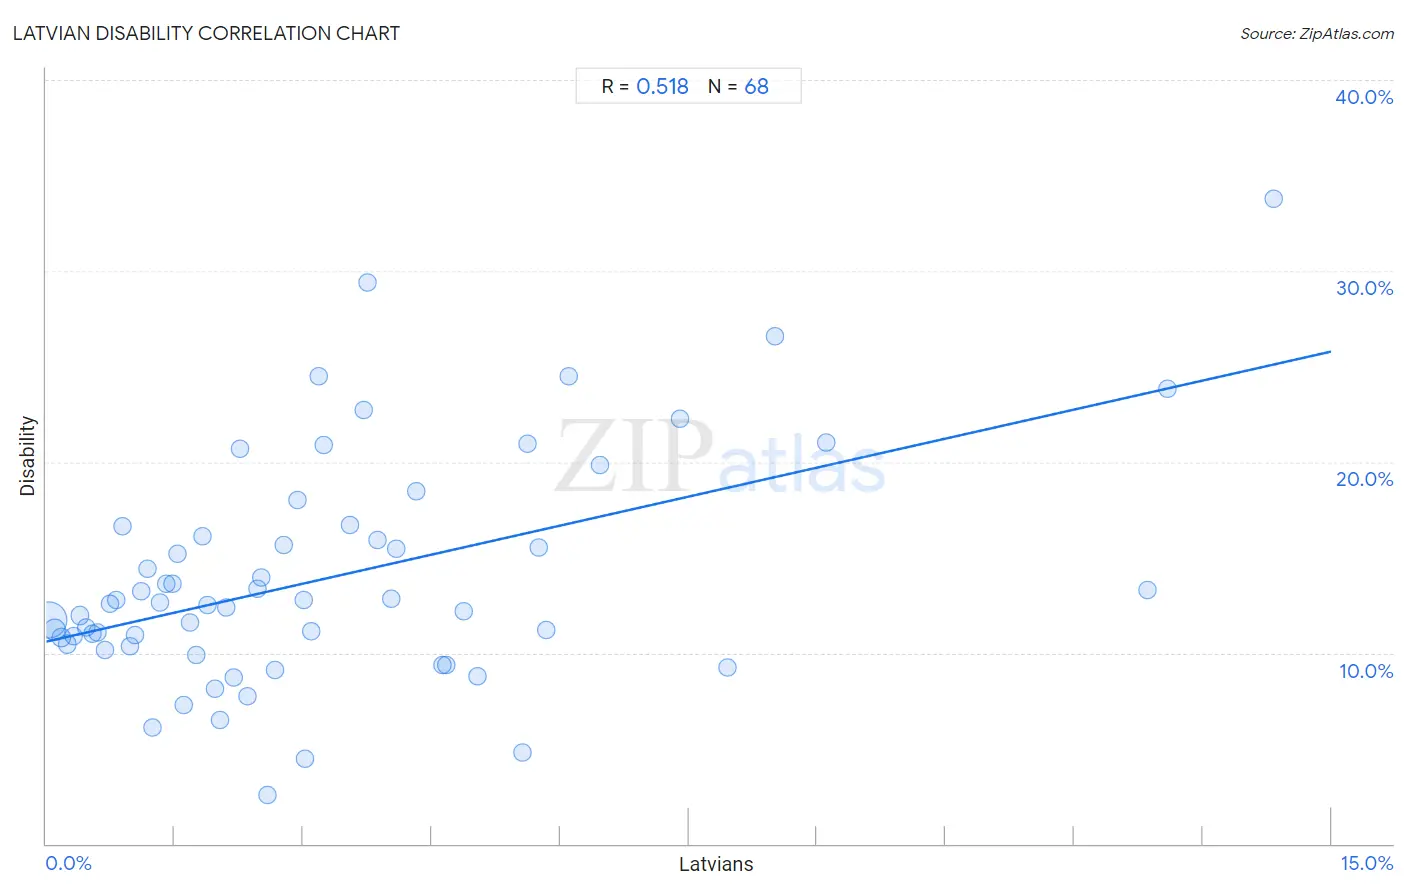
It is essential to understand that the correlation between the percentage of Latvians and percentage of population with a disability does not imply a direct cause-and-effect relationship. It remains uncertain whether the presence of Latvians influences an upward or downward trend in the level of percentage of population with a disability within an area, or if Latvians simply ended up residing in those areas with higher or lower levels of percentage of population with a disability due to other factors.
Demographics Similar to Latvians by Disability
In terms of disability, the demographic groups most similar to Latvians are Immigrants from Croatia (11.4%, a difference of 0.010%), Macedonian (11.4%, a difference of 0.060%), Immigrants from Italy (11.4%, a difference of 0.070%), Immigrants from Europe (11.4%, a difference of 0.070%), and Immigrants from Africa (11.4%, a difference of 0.070%).
| Demographics | Rating | Rank | Disability |
| South Africans | 92.3 /100 | #123 | Exceptional 11.4% |
| South American Indians | 92.2 /100 | #124 | Exceptional 11.4% |
| Costa Ricans | 91.9 /100 | #125 | Exceptional 11.4% |
| Immigrants from Latvia | 90.9 /100 | #126 | Exceptional 11.4% |
| Immigrants from Italy | 90.4 /100 | #127 | Exceptional 11.4% |
| Immigrants from Europe | 90.4 /100 | #128 | Exceptional 11.4% |
| Macedonians | 90.3 /100 | #129 | Exceptional 11.4% |
| Latvians | 89.8 /100 | #130 | Excellent 11.4% |
| Immigrants from Croatia | 89.8 /100 | #131 | Excellent 11.4% |
| Immigrants from Africa | 89.3 /100 | #132 | Excellent 11.4% |
| Arabs | 89.1 /100 | #133 | Excellent 11.4% |
| Immigrants from Guyana | 88.3 /100 | #134 | Excellent 11.4% |
| Ugandans | 87.9 /100 | #135 | Excellent 11.4% |
| Immigrants from St. Vincent and the Grenadines | 87.8 /100 | #136 | Excellent 11.4% |
| Kenyans | 87.1 /100 | #137 | Excellent 11.5% |
Latvian Disability Correlation Summary
| Measurement | Latvian Data | Disability Data |
| Minimum | 0.030% | 2.6% |
| Maximum | 14.3% | 33.8% |
| Range | 14.3% | 31.2% |
| Mean | 3.3% | 13.9% |
| Median | 2.5% | 12.6% |
| Interquartile 25% (IQ1) | 1.2% | 10.4% |
| Interquartile 75% (IQ3) | 4.5% | 16.4% |
| Interquartile Range (IQR) | 3.3% | 6.0% |
| Standard Deviation (Sample) | 3.1% | 6.0% |
| Standard Deviation (Population) | 3.0% | 5.9% |
Correlation Details
| Latvian Percentile | Sample Size | Disability |
[ 0.0% - 0.5% ] 0.030% | 161,515,841 | 11.7% |
[ 0.0% - 0.5% ] 0.100% | 37,607,269 | 11.2% |
[ 0.0% - 0.5% ] 0.17% | 10,125,212 | 10.8% |
[ 0.0% - 0.5% ] 0.25% | 4,610,996 | 10.5% |
[ 0.0% - 0.5% ] 0.32% | 2,638,204 | 10.9% |
[ 0.0% - 0.5% ] 0.39% | 1,360,177 | 12.0% |
[ 0.0% - 0.5% ] 0.47% | 604,235 | 11.3% |
[ 0.5% - 1.0% ] 0.53% | 614,493 | 11.0% |
[ 0.5% - 1.0% ] 0.60% | 467,655 | 11.0% |
[ 0.5% - 1.0% ] 0.68% | 284,731 | 10.1% |
[ 0.5% - 1.0% ] 0.75% | 192,873 | 12.5% |
[ 0.5% - 1.0% ] 0.81% | 87,279 | 12.8% |
[ 0.5% - 1.0% ] 0.89% | 122,132 | 16.7% |
[ 0.5% - 1.0% ] 0.97% | 76,776 | 10.3% |
[ 1.0% - 1.5% ] 1.03% | 107,968 | 10.9% |
[ 1.0% - 1.5% ] 1.11% | 10,507 | 13.2% |
[ 1.0% - 1.5% ] 1.18% | 31,071 | 14.4% |
[ 1.0% - 1.5% ] 1.24% | 6,472 | 6.1% |
[ 1.0% - 1.5% ] 1.33% | 21,033 | 12.6% |
[ 1.0% - 1.5% ] 1.40% | 20,393 | 13.6% |
[ 1.0% - 1.5% ] 1.48% | 11,493 | 13.6% |
[ 1.5% - 2.0% ] 1.53% | 47,136 | 15.2% |
[ 1.5% - 2.0% ] 1.61% | 10,210 | 7.3% |
[ 1.5% - 2.0% ] 1.68% | 12,516 | 11.6% |
[ 1.5% - 2.0% ] 1.75% | 4,502 | 9.9% |
[ 1.5% - 2.0% ] 1.82% | 11,282 | 16.1% |
[ 1.5% - 2.0% ] 1.88% | 9,435 | 12.5% |
[ 1.5% - 2.0% ] 1.98% | 13,973 | 8.1% |
[ 2.0% - 2.5% ] 2.03% | 4,276 | 6.5% |
[ 2.0% - 2.5% ] 2.10% | 1,807 | 12.3% |
[ 2.0% - 2.5% ] 2.19% | 20,529 | 8.7% |
[ 2.0% - 2.5% ] 2.25% | 3,992 | 20.7% |
[ 2.0% - 2.5% ] 2.35% | 8,050 | 7.8% |
[ 2.0% - 2.5% ] 2.46% | 1,745 | 13.4% |
[ 2.5% - 3.0% ] 2.51% | 1,392 | 13.9% |
[ 2.5% - 3.0% ] 2.58% | 155 | 2.6% |
[ 2.5% - 3.0% ] 2.67% | 13,497 | 9.1% |
[ 2.5% - 3.0% ] 2.77% | 3,575 | 15.7% |
[ 2.5% - 3.0% ] 2.94% | 2,010 | 18.0% |
[ 3.0% - 3.5% ] 3.01% | 133 | 12.8% |
[ 3.0% - 3.5% ] 3.03% | 8,425 | 4.4% |
[ 3.0% - 3.5% ] 3.09% | 162 | 11.1% |
[ 3.0% - 3.5% ] 3.17% | 441 | 24.5% |
[ 3.0% - 3.5% ] 3.23% | 402 | 20.9% |
[ 3.5% - 4.0% ] 3.55% | 732 | 16.7% |
[ 3.5% - 4.0% ] 3.70% | 811 | 22.7% |
[ 3.5% - 4.0% ] 3.74% | 187 | 29.4% |
[ 3.5% - 4.0% ] 3.87% | 1,472 | 15.9% |
[ 4.0% - 4.5% ] 4.03% | 2,036 | 12.8% |
[ 4.0% - 4.5% ] 4.09% | 220 | 15.5% |
[ 4.0% - 4.5% ] 4.32% | 1,343 | 18.5% |
[ 4.5% - 5.0% ] 4.62% | 2,143 | 9.3% |
[ 4.5% - 5.0% ] 4.67% | 300 | 9.3% |
[ 4.5% - 5.0% ] 4.88% | 41 | 12.2% |
[ 5.0% - 5.5% ] 5.03% | 159 | 8.8% |
[ 5.5% - 6.0% ] 5.56% | 126 | 4.8% |
[ 5.5% - 6.0% ] 5.62% | 4,611 | 20.9% |
[ 5.5% - 6.0% ] 5.75% | 226 | 15.5% |
[ 5.5% - 6.0% ] 5.83% | 223 | 11.2% |
[ 6.0% - 6.5% ] 6.10% | 771 | 24.5% |
[ 6.0% - 6.5% ] 6.46% | 449 | 19.8% |
[ 7.0% - 7.5% ] 7.39% | 2,313 | 22.3% |
[ 7.5% - 8.0% ] 7.95% | 390 | 9.2% |
[ 8.5% - 9.0% ] 8.51% | 94 | 26.6% |
[ 9.0% - 9.5% ] 9.11% | 428 | 21.0% |
[ 12.5% - 13.0% ] 12.85% | 428 | 13.3% |
[ 13.0% - 13.5% ] 13.10% | 84 | 23.8% |
[ 14.0% - 14.5% ] 14.32% | 1,990 | 33.8% |