Latvian Married-Couple Family Poverty

COMPARE

Latvian
Race
Ancestry
AfghanAfricanAlaska NativeAlaskan AthabascanAlbanianAleutAlsatianAmericanApacheArabArapahoArgentineanArmenianAssyrian/Chaldean/SyriacAustralianAustrianBahamianBangladeshiBarbadianBasqueBelgianBelizeanBermudanBhutaneseBlackfeetBolivianBrazilianBritishBritish West IndianBulgarianBurmeseCajunCambodianCanadianCape VerdeanCarpatho RusynCelticCentral AmericanCentral American IndianCherokeeCheyenneChickasawChileanChineseChippewaChoctawColombianColvilleComancheCosta RicanCreeCreekCroatianCrowCubanCypriotCzechCzechoslovakianDanishDelawareDominicanDutchDutch West IndianEastern EuropeanEcuadorianEgyptianEnglishEstonianEthiopianEuropeanFijianFilipinoFinnishFrenchFrench American IndianFrench CanadianGermanGerman RussianGhanaianGreekGuamanian/ChamorroGuatemalanGuyaneseHaitianHmongHonduranHopiHoumaHungarianIcelanderIndian (Asian)IndonesianInupiatIranianIraqiIrishIroquoisIsraeliItalianJamaicanJapaneseJordanianKenyanKiowaKoreanLaotianLatvianLebaneseLiberianLithuanianLumbeeLuxembourgerMacedonianMalaysianMalteseMarshalleseMenomineeMexicanMexican American IndianMongolianMoroccanNative HawaiianNavajoNepaleseNew ZealanderNicaraguanNigerianNorthern EuropeanNorwegianOkinawanOsageOttawaPaiutePakistaniPalestinianPanamanianParaguayanPennsylvania GermanPeruvianPimaPolishPortuguesePotawatomiPuebloPuerto RicanPuget Sound SalishRomanianRussianSalvadoranSamoanScandinavianScotch-IrishScottishSeminoleSenegaleseSerbianShoshoneSierra LeoneanSiouxSlavicSlovakSloveneSomaliSouth AfricanSouth AmericanSouth American IndianSoviet UnionSpaniardSpanishSpanish AmericanSpanish American IndianSri LankanSubsaharan AfricanSudaneseSwedishSwissSyrianTaiwaneseThaiTlingit-HaidaTohono O'OdhamTonganTrinidadian and TobagonianTsimshianTurkishU.S. Virgin IslanderUgandanUkrainianUruguayanUteVenezuelanVietnameseWelshWest IndianYakamaYaquiYugoslavianYumanYup'ikZimbabwean
Immigration
NonimmigrantsImmigrantsAfghanistanAfricaAlbaniaArgentinaArmeniaAsiaAustraliaAustriaBahamasBangladeshBarbadosBelarusBelgiumBelizeBoliviaBosnia and HerzegovinaBrazilBulgariaBurma/MyanmarCabo VerdeCambodiaCameroonCanadaCaribbeanCentral AmericaChileChinaColombiaCongoCosta RicaCroatiaCubaCzechoslovakiaDenmarkDominicaDominican RepublicEastern AfricaEastern AsiaEastern EuropeEcuadorEgyptEl SalvadorEnglandEritreaEthiopiaEuropeFijiFranceGermanyGhanaGreeceGrenadaGuatemalaGuyanaHaitiHondurasHong KongHungaryIndiaIndonesiaIranIraqIrelandIsraelItalyJamaicaJapanJordanKazakhstanKenyaKoreaKuwaitLaosLatin AmericaLatviaLebanonLiberiaLithuaniaMalaysiaMexicoMicronesiaMiddle AfricaMoldovaMoroccoNepalNetherlandsNicaraguaNigeriaNorth AmericaNorth MacedoniaNorthern AfricaNorthern EuropeNorwayOceaniaPakistanPanamaPeruPhilippinesPolandPortugalRomaniaRussiaSaudi ArabiaScotlandSenegalSerbiaSierra LeoneSingaporeSomaliaSouth AfricaSouth AmericaSouth Central AsiaSouth Eastern AsiaSouthern EuropeSpainSri LankaSt. Vincent and the GrenadinesSudanSwedenSwitzerlandSyriaTaiwanThailandTrinidad and TobagoTurkeyUgandaUkraineUruguayUzbekistanVenezuelaVietnamWest IndiesWestern AfricaWestern AsiaWestern EuropeYemenZaireZimbabweAzores
Select to Compare
Race
Ancestry
AfghanAfricanAlaska NativeAlaskan AthabascanAlbanianAleutAlsatianAmericanApacheArabArapahoArgentineanArmenianAssyrian/Chaldean/SyriacAustralianAustrianBahamianBangladeshiBarbadianBasqueBelgianBelizeanBermudanBhutaneseBlackfeetBolivianBrazilianBritishBritish West IndianBulgarianBurmeseCajunCambodianCanadianCape VerdeanCarpatho RusynCelticCentral AmericanCentral American IndianCherokeeCheyenneChickasawChileanChineseChippewaChoctawColombianColvilleComancheCosta RicanCreeCreekCroatianCrowCubanCypriotCzechCzechoslovakianDanishDelawareDominicanDutchDutch West IndianEastern EuropeanEcuadorianEgyptianEnglishEstonianEthiopianEuropeanFijianFilipinoFinnishFrenchFrench American IndianFrench CanadianGermanGerman RussianGhanaianGreekGuamanian/ChamorroGuatemalanGuyaneseHaitianHmongHonduranHopiHoumaHungarianIcelanderIndian (Asian)IndonesianInupiatIranianIraqiIrishIroquoisIsraeliItalianJamaicanJapaneseJordanianKenyanKiowaKoreanLaotianLebaneseLiberianLithuanianLumbeeLuxembourgerMacedonianMalaysianMalteseMarshalleseMenomineeMexicanMexican American IndianMongolianMoroccanNative HawaiianNavajoNepaleseNew ZealanderNicaraguanNigerianNorthern EuropeanNorwegianOkinawanOsageOttawaPaiutePakistaniPalestinianPanamanianParaguayanPennsylvania GermanPeruvianPimaPolishPortuguesePotawatomiPuebloPuerto RicanPuget Sound SalishRomanianRussianSalvadoranSamoanScandinavianScotch-IrishScottishSeminoleSenegaleseSerbianShoshoneSierra LeoneanSiouxSlavicSlovakSloveneSomaliSouth AfricanSouth AmericanSouth American IndianSoviet UnionSpaniardSpanishSpanish AmericanSpanish American IndianSri LankanSubsaharan AfricanSudaneseSwedishSwissSyrianTaiwaneseThaiTlingit-HaidaTohono O'OdhamTonganTrinidadian and TobagonianTsimshianTurkishU.S. Virgin IslanderUgandanUkrainianUruguayanUteVenezuelanVietnameseWelshWest IndianYakamaYaquiYugoslavianYumanYup'ikZimbabwean
Immigration
NonimmigrantsImmigrantsAfghanistanAfricaAlbaniaArgentinaArmeniaAsiaAustraliaAustriaBahamasBangladeshBarbadosBelarusBelgiumBelizeBoliviaBosnia and HerzegovinaBrazilBulgariaBurma/MyanmarCabo VerdeCambodiaCameroonCanadaCaribbeanCentral AmericaChileChinaColombiaCongoCosta RicaCroatiaCubaCzechoslovakiaDenmarkDominicaDominican RepublicEastern AfricaEastern AsiaEastern EuropeEcuadorEgyptEl SalvadorEnglandEritreaEthiopiaEuropeFijiFranceGermanyGhanaGreeceGrenadaGuatemalaGuyanaHaitiHondurasHong KongHungaryIndiaIndonesiaIranIraqIrelandIsraelItalyJamaicaJapanJordanKazakhstanKenyaKoreaKuwaitLaosLatin AmericaLatviaLebanonLiberiaLithuaniaMalaysiaMexicoMicronesiaMiddle AfricaMoldovaMoroccoNepalNetherlandsNicaraguaNigeriaNorth AmericaNorth MacedoniaNorthern AfricaNorthern EuropeNorwayOceaniaPakistanPanamaPeruPhilippinesPolandPortugalRomaniaRussiaSaudi ArabiaScotlandSenegalSerbiaSierra LeoneSingaporeSomaliaSouth AfricaSouth AmericaSouth Central AsiaSouth Eastern AsiaSouthern EuropeSpainSri LankaSt. Vincent and the GrenadinesSudanSwedenSwitzerlandSyriaTaiwanThailandTrinidad and TobagoTurkeyUgandaUkraineUruguayUzbekistanVenezuelaVietnamWest IndiesWestern AfricaWestern AsiaWestern EuropeYemenZaireZimbabweAzores
Married-Couple Family Poverty
Income
Poverty
Unemployment
Labor Participation
Family Structure
Vehicle Availability
Education Level
Disability

Latvian Married-Couple Family Poverty
Exceptional

3.9%
POVERTY | MARRIED-COUPLE FAMILIES
100.0/ 100
METRIC RATING
7th/ 347
METRIC RANK

Latvian Married-Couple Family Poverty Correlation Chart

The statistical analysis conducted on geographies consisting of 219,282,296 people shows a weak positive correlation between the proportion of Latvians and poverty level among married-couple families in the United States with a correlation coefficient (R) of 0.210 and weighted average of 3.9%. On average, for every 1% (one percent) increase in Latvians within a typical geography, there is an increase of 0.36% in poverty level among married-couple families.
Latvian Married-Couple Family Poverty
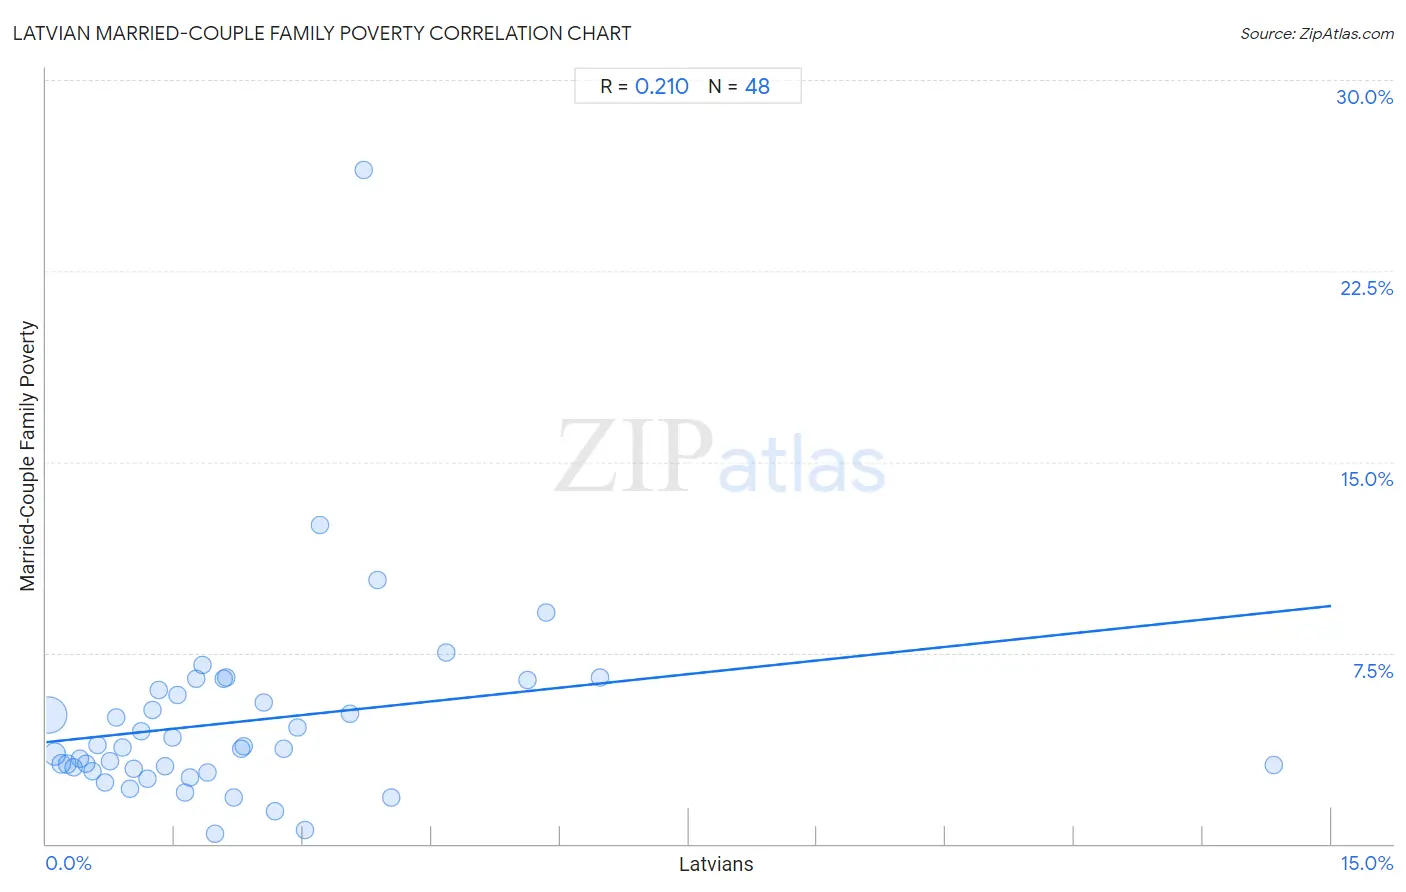
It is essential to understand that the correlation between the percentage of Latvians and poverty level among married-couple families does not imply a direct cause-and-effect relationship. It remains uncertain whether the presence of Latvians influences an upward or downward trend in the level of poverty level among married-couple families within an area, or if Latvians simply ended up residing in those areas with higher or lower levels of poverty level among married-couple families due to other factors.

Demographics Similar to Latvians by Married-Couple Family Poverty

In terms of married-couple family poverty, the demographic groups most similar to Latvians are Luxembourger (3.9%, a difference of 0.52%), Thai (3.9%, a difference of 0.54%), Croatian (3.9%, a difference of 0.98%), Carpatho Rusyn (3.9%, a difference of 1.0%), and Swedish (3.9%, a difference of 1.1%).
DemographicsRating | RankMarried-Couple Family Poverty
Immigrants from India
100.0
/100
|
#1
Exceptional
3.6%
Chinese
100.0
/100
|
#2
Exceptional
3.6%
Norwegians
100.0
/100
|
#3
Exceptional
3.7%
Slovenes
100.0
/100
|
#4
Exceptional
3.8%
Swedes
100.0
/100
|
#5
Exceptional
3.9%
Luxembourgers
100.0
/100
|
#6
Exceptional
3.9%
Latvians
100.0
/100
|
#7
Exceptional
3.9%
Thais
100.0
/100
|
#8
Exceptional
3.9%
Croatians
100.0
/100
|
#9
Exceptional
3.9%
Carpatho Rusyns
100.0
/100
|
#10
Exceptional
3.9%
Lithuanians
100.0
/100
|
#11
Exceptional
4.0%
Bulgarians
100.0
/100
|
#12
Exceptional
4.0%
Czechs
100.0
/100
|
#13
Exceptional
4.0%
Slovaks
100.0
/100
|
#14
Exceptional
4.0%
Poles
100.0
/100
|
#15
Exceptional
4.0%

Latvian Married-Couple Family Poverty Correlation Summary

MeasurementLatvian DataMarried-Couple Family Poverty Data
Minimum0.030%0.39%
Maximum14.3%26.5%
Range14.3%26.1%
Mean2.3%4.8%
Median1.7%3.8%
Interquartile 25% (IQ1)0.85%2.9%
Interquartile 75% (IQ3)2.9%5.9%
Interquartile Range (IQR)2.0%3.0%
Standard Deviation (Sample)2.3%4.0%
Standard Deviation (Population)2.3%3.9%

Correlation Details

Latvian PercentileSample SizeMarried-Couple Family Poverty
[
0.0%
-
0.5%
]
0.030%
161,294,3535.1%
[
0.0%
-
0.5%
]
0.100%
37,262,2593.5%
[
0.0%
-
0.5%
]
0.17%
9,870,6633.1%
[
0.0%
-
0.5%
]
0.25%
4,426,9963.1%
[
0.0%
-
0.5%
]
0.32%
2,533,1573.0%
[
0.0%
-
0.5%
]
0.39%
1,289,6733.3%
[
0.0%
-
0.5%
]
0.47%
565,2483.1%
[
0.5%
-
1.0%
]
0.53%
598,4012.8%
[
0.5%
-
1.0%
]
0.60%
433,6943.9%
[
0.5%
-
1.0%
]
0.69%
259,3022.4%
[
0.5%
-
1.0%
]
0.75%
177,3493.2%
[
0.5%
-
1.0%
]
0.81%
79,8954.9%
[
0.5%
-
1.0%
]
0.89%
100,3793.8%
[
0.5%
-
1.0%
]
0.98%
70,2242.2%
[
1.0%
-
1.5%
]
1.03%
94,4192.9%
[
1.0%
-
1.5%
]
1.11%
7,4154.4%
[
1.0%
-
1.5%
]
1.18%
24,4762.5%
[
1.0%
-
1.5%
]
1.24%
6,4725.3%
[
1.0%
-
1.5%
]
1.31%
8,7666.0%
[
1.0%
-
1.5%
]
1.38%
11,4103.0%
[
1.0%
-
1.5%
]
1.48%
11,4934.2%
[
1.5%
-
2.0%
]
1.53%
38,1665.8%
[
1.5%
-
2.0%
]
1.62%
3,2062.0%
[
1.5%
-
2.0%
]
1.68%
12,5162.6%
[
1.5%
-
2.0%
]
1.75%
4,5026.5%
[
1.5%
-
2.0%
]
1.82%
9,3907.0%
[
1.5%
-
2.0%
]
1.88%
8,1572.8%
[
1.5%
-
2.0%
]
1.98%
13,5090.39%
[
2.0%
-
2.5%
]
2.08%
1,4456.5%
[
2.0%
-
2.5%
]
2.10%
1,4306.6%
[
2.0%
-
2.5%
]
2.19%
20,5291.8%
[
2.0%
-
2.5%
]
2.27%
1,1433.7%
[
2.0%
-
2.5%
]
2.31%
1,8613.8%
[
2.5%
-
3.0%
]
2.53%
795.6%
[
2.5%
-
3.0%
]
2.67%
13,4971.3%
[
2.5%
-
3.0%
]
2.77%
3,5753.7%
[
2.5%
-
3.0%
]
2.94%
2,0104.6%
[
3.0%
-
3.5%
]
3.03%
8,4250.54%
[
3.0%
-
3.5%
]
3.19%
18812.5%
[
3.5%
-
4.0%
]
3.55%
7325.1%
[
3.5%
-
4.0%
]
3.70%
81126.5%
[
3.5%
-
4.0%
]
3.87%
1,47210.4%
[
4.0%
-
4.5%
]
4.03%
2,0361.8%
[
4.5%
-
5.0%
]
4.67%
3007.5%
[
5.5%
-
6.0%
]
5.62%
4,6116.4%
[
5.5%
-
6.0%
]
5.83%
2239.1%
[
6.0%
-
6.5%
]
6.46%
4496.5%
[
14.0%
-
14.5%
]
14.32%
1,9903.1%