Latvian 2 or more Vehicles in Household
COMPARE
Latvian
Select to Compare
2 or more Vehicles in Household
Latvian 2 or more Vehicles in Household
56.2%
2+ VEHICLES AVAILABLE
83.6/ 100
METRIC RATING
140th/ 347
METRIC RANK
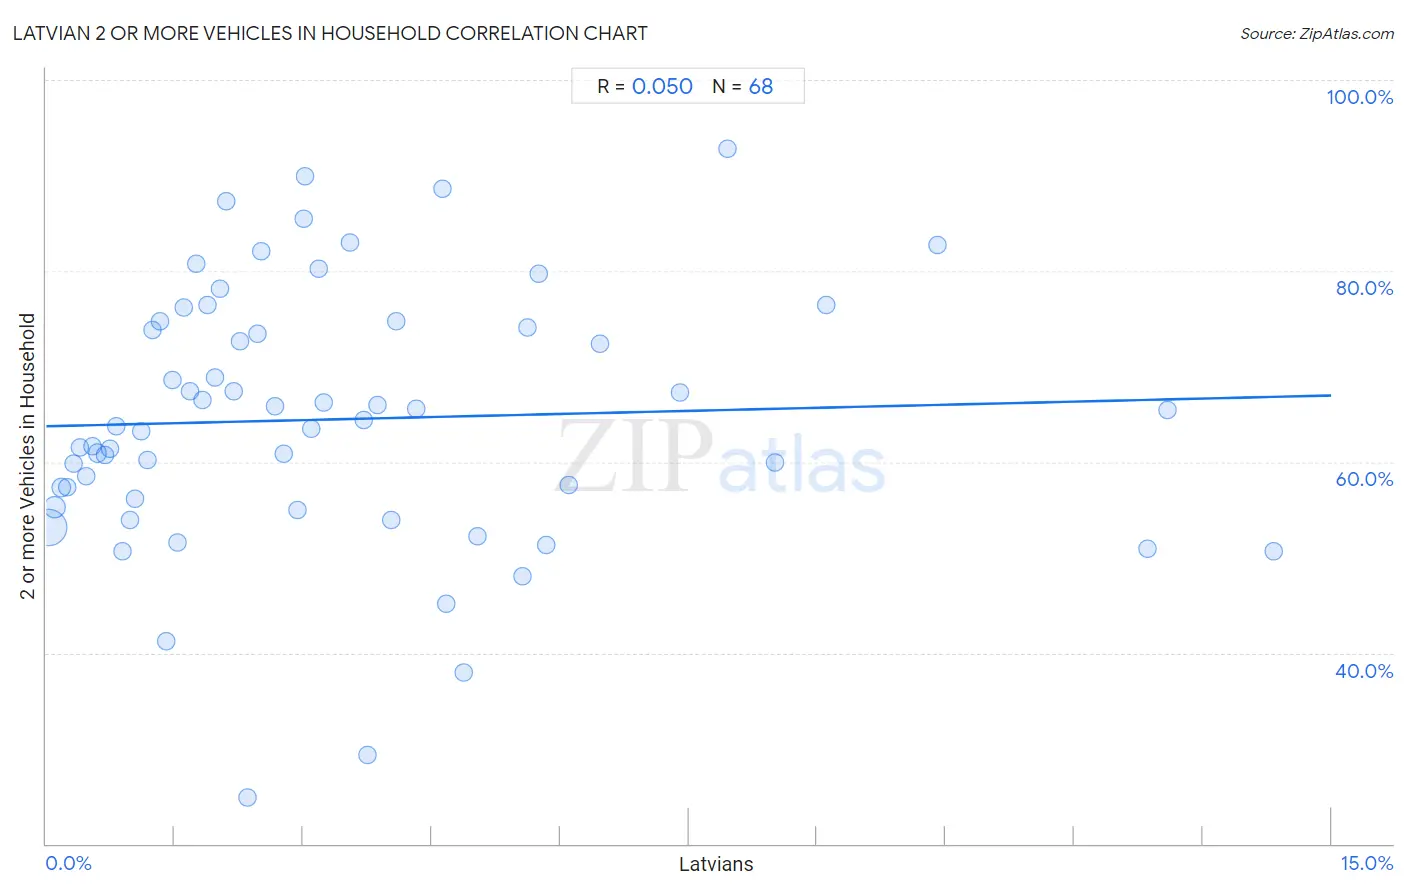
Latvian 2 or more Vehicles in Household Correlation Chart
The statistical analysis conducted on geographies consisting of 220,663,993 people shows no correlation between the proportion of Latvians and percentage of households with 2 or more vehicles available in the United States with a correlation coefficient (R) of 0.050 and weighted average of 56.2%. On average, for every 1% (one percent) increase in Latvians within a typical geography, there is an increase of 0.21% in percentage of households with 2 or more vehicles available.
It is essential to understand that the correlation between the percentage of Latvians and percentage of households with 2 or more vehicles available does not imply a direct cause-and-effect relationship. It remains uncertain whether the presence of Latvians influences an upward or downward trend in the level of percentage of households with 2 or more vehicles available within an area, or if Latvians simply ended up residing in those areas with higher or lower levels of percentage of households with 2 or more vehicles available due to other factors.
Demographics Similar to Latvians by 2 or more Vehicles in Household
In terms of 2 or more vehicles in household, the demographic groups most similar to Latvians are Immigrants from Cambodia (56.2%, a difference of 0.0%), South African (56.2%, a difference of 0.040%), Armenian (56.3%, a difference of 0.050%), Salvadoran (56.3%, a difference of 0.080%), and Cuban (56.3%, a difference of 0.090%).
| Demographics | Rating | Rank | 2 or more Vehicles in Household |
| Comanche | 88.4 /100 | #133 | Excellent 56.5% |
| Immigrants from the Azores | 86.6 /100 | #134 | Excellent 56.4% |
| Blackfeet | 86.5 /100 | #135 | Excellent 56.4% |
| Immigrants from Asia | 86.0 /100 | #136 | Excellent 56.3% |
| Cubans | 84.8 /100 | #137 | Excellent 56.3% |
| Salvadorans | 84.7 /100 | #138 | Excellent 56.3% |
| Armenians | 84.3 /100 | #139 | Excellent 56.3% |
| Latvians | 83.6 /100 | #140 | Excellent 56.2% |
| Immigrants from Cambodia | 83.6 /100 | #141 | Excellent 56.2% |
| South Africans | 83.1 /100 | #142 | Excellent 56.2% |
| Seminole | 81.7 /100 | #143 | Excellent 56.2% |
| Immigrants from Syria | 81.4 /100 | #144 | Excellent 56.2% |
| Syrians | 81.2 /100 | #145 | Excellent 56.2% |
| Venezuelans | 80.7 /100 | #146 | Excellent 56.1% |
| Serbians | 80.3 /100 | #147 | Excellent 56.1% |
Latvian 2 or more Vehicles in Household Correlation Summary
| Measurement | Latvian Data | 2 or more Vehicles in Household Data |
| Minimum | 0.030% | 24.9% |
| Maximum | 14.3% | 92.8% |
| Range | 14.3% | 67.9% |
| Mean | 3.4% | 64.5% |
| Median | 2.5% | 64.1% |
| Interquartile 25% (IQ1) | 1.2% | 55.7% |
| Interquartile 75% (IQ3) | 4.6% | 74.4% |
| Interquartile Range (IQR) | 3.4% | 18.7% |
| Standard Deviation (Sample) | 3.2% | 13.8% |
| Standard Deviation (Population) | 3.2% | 13.7% |
Correlation Details
| Latvian Percentile | Sample Size | 2 or more Vehicles in Household |
[ 0.0% - 0.5% ] 0.030% | 161,503,245 | 53.1% |
[ 0.0% - 0.5% ] 0.100% | 37,594,682 | 55.3% |
[ 0.0% - 0.5% ] 0.17% | 10,113,871 | 57.3% |
[ 0.0% - 0.5% ] 0.25% | 4,610,996 | 57.4% |
[ 0.0% - 0.5% ] 0.32% | 2,638,204 | 59.8% |
[ 0.0% - 0.5% ] 0.39% | 1,353,368 | 61.5% |
[ 0.0% - 0.5% ] 0.47% | 598,377 | 58.6% |
[ 0.5% - 1.0% ] 0.53% | 614,493 | 61.6% |
[ 0.5% - 1.0% ] 0.60% | 467,655 | 60.9% |
[ 0.5% - 1.0% ] 0.68% | 282,488 | 60.8% |
[ 0.5% - 1.0% ] 0.75% | 192,873 | 61.3% |
[ 0.5% - 1.0% ] 0.81% | 87,279 | 63.8% |
[ 0.5% - 1.0% ] 0.89% | 119,240 | 50.7% |
[ 0.5% - 1.0% ] 0.97% | 76,776 | 53.9% |
[ 1.0% - 1.5% ] 1.03% | 107,968 | 56.1% |
[ 1.0% - 1.5% ] 1.11% | 10,507 | 63.2% |
[ 1.0% - 1.5% ] 1.18% | 31,071 | 60.2% |
[ 1.0% - 1.5% ] 1.24% | 6,472 | 73.8% |
[ 1.0% - 1.5% ] 1.33% | 21,033 | 74.7% |
[ 1.0% - 1.5% ] 1.40% | 20,393 | 41.2% |
[ 1.0% - 1.5% ] 1.48% | 11,493 | 68.6% |
[ 1.5% - 2.0% ] 1.53% | 47,136 | 51.6% |
[ 1.5% - 2.0% ] 1.61% | 10,210 | 76.2% |
[ 1.5% - 2.0% ] 1.68% | 12,516 | 67.4% |
[ 1.5% - 2.0% ] 1.75% | 4,502 | 80.7% |
[ 1.5% - 2.0% ] 1.82% | 11,282 | 66.4% |
[ 1.5% - 2.0% ] 1.88% | 9,435 | 76.5% |
[ 1.5% - 2.0% ] 1.98% | 13,973 | 68.9% |
[ 2.0% - 2.5% ] 2.03% | 4,276 | 78.1% |
[ 2.0% - 2.5% ] 2.10% | 1,807 | 87.4% |
[ 2.0% - 2.5% ] 2.19% | 20,529 | 67.4% |
[ 2.0% - 2.5% ] 2.25% | 3,992 | 72.6% |
[ 2.0% - 2.5% ] 2.35% | 8,050 | 24.9% |
[ 2.0% - 2.5% ] 2.46% | 1,745 | 73.4% |
[ 2.5% - 3.0% ] 2.51% | 1,392 | 82.0% |
[ 2.5% - 3.0% ] 2.67% | 13,497 | 65.9% |
[ 2.5% - 3.0% ] 2.77% | 3,575 | 60.8% |
[ 2.5% - 3.0% ] 2.94% | 2,010 | 54.9% |
[ 3.0% - 3.5% ] 3.01% | 133 | 85.5% |
[ 3.0% - 3.5% ] 3.03% | 8,425 | 89.9% |
[ 3.0% - 3.5% ] 3.09% | 162 | 63.5% |
[ 3.0% - 3.5% ] 3.17% | 441 | 80.2% |
[ 3.0% - 3.5% ] 3.23% | 402 | 66.3% |
[ 3.5% - 4.0% ] 3.55% | 732 | 83.0% |
[ 3.5% - 4.0% ] 3.70% | 811 | 64.4% |
[ 3.5% - 4.0% ] 3.74% | 187 | 29.3% |
[ 3.5% - 4.0% ] 3.87% | 1,472 | 66.0% |
[ 4.0% - 4.5% ] 4.03% | 2,036 | 53.9% |
[ 4.0% - 4.5% ] 4.09% | 220 | 74.7% |
[ 4.0% - 4.5% ] 4.32% | 1,343 | 65.6% |
[ 4.5% - 5.0% ] 4.62% | 2,143 | 88.6% |
[ 4.5% - 5.0% ] 4.67% | 300 | 45.2% |
[ 4.5% - 5.0% ] 4.88% | 41 | 37.9% |
[ 5.0% - 5.5% ] 5.03% | 159 | 52.2% |
[ 5.5% - 6.0% ] 5.56% | 126 | 48.0% |
[ 5.5% - 6.0% ] 5.62% | 4,611 | 74.1% |
[ 5.5% - 6.0% ] 5.75% | 226 | 79.7% |
[ 5.5% - 6.0% ] 5.83% | 223 | 51.4% |
[ 6.0% - 6.5% ] 6.10% | 771 | 57.6% |
[ 6.0% - 6.5% ] 6.46% | 449 | 72.4% |
[ 7.0% - 7.5% ] 7.39% | 2,313 | 67.3% |
[ 7.5% - 8.0% ] 7.95% | 390 | 92.8% |
[ 8.5% - 9.0% ] 8.51% | 94 | 60.0% |
[ 9.0% - 9.5% ] 9.11% | 428 | 76.4% |
[ 10.0% - 10.5% ] 10.41% | 442 | 82.8% |
[ 12.5% - 13.0% ] 12.85% | 428 | 50.9% |
[ 13.0% - 13.5% ] 13.10% | 84 | 65.4% |
[ 14.0% - 14.5% ] 14.32% | 1,990 | 50.7% |