Latvian Self-Care Disability

COMPARE

Latvian
Race
Ancestry
AfghanAfricanAlaska NativeAlaskan AthabascanAlbanianAleutAlsatianAmericanApacheArabArapahoArgentineanArmenianAssyrian/Chaldean/SyriacAustralianAustrianBahamianBangladeshiBarbadianBasqueBelgianBelizeanBermudanBhutaneseBlackfeetBolivianBrazilianBritishBritish West IndianBulgarianBurmeseCajunCambodianCanadianCape VerdeanCarpatho RusynCelticCentral AmericanCentral American IndianCherokeeCheyenneChickasawChileanChineseChippewaChoctawColombianColvilleComancheCosta RicanCreeCreekCroatianCrowCubanCypriotCzechCzechoslovakianDanishDelawareDominicanDutchDutch West IndianEastern EuropeanEcuadorianEgyptianEnglishEstonianEthiopianEuropeanFijianFilipinoFinnishFrenchFrench American IndianFrench CanadianGermanGerman RussianGhanaianGreekGuamanian/ChamorroGuatemalanGuyaneseHaitianHmongHonduranHopiHoumaHungarianIcelanderIndian (Asian)IndonesianInupiatIranianIraqiIrishIroquoisIsraeliItalianJamaicanJapaneseJordanianKenyanKiowaKoreanLaotianLatvianLebaneseLiberianLithuanianLumbeeLuxembourgerMacedonianMalaysianMalteseMarshalleseMenomineeMexicanMexican American IndianMongolianMoroccanNative HawaiianNavajoNepaleseNew ZealanderNicaraguanNigerianNorthern EuropeanNorwegianOkinawanOsageOttawaPaiutePakistaniPalestinianPanamanianParaguayanPennsylvania GermanPeruvianPimaPolishPortuguesePotawatomiPuebloPuerto RicanPuget Sound SalishRomanianRussianSalvadoranSamoanScandinavianScotch-IrishScottishSeminoleSenegaleseSerbianShoshoneSierra LeoneanSiouxSlavicSlovakSloveneSomaliSouth AfricanSouth AmericanSouth American IndianSoviet UnionSpaniardSpanishSpanish AmericanSpanish American IndianSri LankanSubsaharan AfricanSudaneseSwedishSwissSyrianTaiwaneseThaiTlingit-HaidaTohono O'OdhamTonganTrinidadian and TobagonianTsimshianTurkishU.S. Virgin IslanderUgandanUkrainianUruguayanUteVenezuelanVietnameseWelshWest IndianYakamaYaquiYugoslavianYumanYup'ikZimbabwean
Immigration
NonimmigrantsImmigrantsAfghanistanAfricaAlbaniaArgentinaArmeniaAsiaAustraliaAustriaBahamasBangladeshBarbadosBelarusBelgiumBelizeBoliviaBosnia and HerzegovinaBrazilBulgariaBurma/MyanmarCabo VerdeCambodiaCameroonCanadaCaribbeanCentral AmericaChileChinaColombiaCongoCosta RicaCroatiaCubaCzechoslovakiaDenmarkDominicaDominican RepublicEastern AfricaEastern AsiaEastern EuropeEcuadorEgyptEl SalvadorEnglandEritreaEthiopiaEuropeFijiFranceGermanyGhanaGreeceGrenadaGuatemalaGuyanaHaitiHondurasHong KongHungaryIndiaIndonesiaIranIraqIrelandIsraelItalyJamaicaJapanJordanKazakhstanKenyaKoreaKuwaitLaosLatin AmericaLatviaLebanonLiberiaLithuaniaMalaysiaMexicoMicronesiaMiddle AfricaMoldovaMoroccoNepalNetherlandsNicaraguaNigeriaNorth AmericaNorth MacedoniaNorthern AfricaNorthern EuropeNorwayOceaniaPakistanPanamaPeruPhilippinesPolandPortugalRomaniaRussiaSaudi ArabiaScotlandSenegalSerbiaSierra LeoneSingaporeSomaliaSouth AfricaSouth AmericaSouth Central AsiaSouth Eastern AsiaSouthern EuropeSpainSri LankaSt. Vincent and the GrenadinesSudanSwedenSwitzerlandSyriaTaiwanThailandTrinidad and TobagoTurkeyUgandaUkraineUruguayUzbekistanVenezuelaVietnamWest IndiesWestern AfricaWestern AsiaWestern EuropeYemenZaireZimbabweAzores
Select to Compare
Race
Ancestry
AfghanAfricanAlaska NativeAlaskan AthabascanAlbanianAleutAlsatianAmericanApacheArabArapahoArgentineanArmenianAssyrian/Chaldean/SyriacAustralianAustrianBahamianBangladeshiBarbadianBasqueBelgianBelizeanBermudanBhutaneseBlackfeetBolivianBrazilianBritishBritish West IndianBulgarianBurmeseCajunCambodianCanadianCape VerdeanCarpatho RusynCelticCentral AmericanCentral American IndianCherokeeCheyenneChickasawChileanChineseChippewaChoctawColombianColvilleComancheCosta RicanCreeCreekCroatianCrowCubanCypriotCzechCzechoslovakianDanishDelawareDominicanDutchDutch West IndianEastern EuropeanEcuadorianEgyptianEnglishEstonianEthiopianEuropeanFijianFilipinoFinnishFrenchFrench American IndianFrench CanadianGermanGerman RussianGhanaianGreekGuamanian/ChamorroGuatemalanGuyaneseHaitianHmongHonduranHopiHoumaHungarianIcelanderIndian (Asian)IndonesianInupiatIranianIraqiIrishIroquoisIsraeliItalianJamaicanJapaneseJordanianKenyanKiowaKoreanLaotianLebaneseLiberianLithuanianLumbeeLuxembourgerMacedonianMalaysianMalteseMarshalleseMenomineeMexicanMexican American IndianMongolianMoroccanNative HawaiianNavajoNepaleseNew ZealanderNicaraguanNigerianNorthern EuropeanNorwegianOkinawanOsageOttawaPaiutePakistaniPalestinianPanamanianParaguayanPennsylvania GermanPeruvianPimaPolishPortuguesePotawatomiPuebloPuerto RicanPuget Sound SalishRomanianRussianSalvadoranSamoanScandinavianScotch-IrishScottishSeminoleSenegaleseSerbianShoshoneSierra LeoneanSiouxSlavicSlovakSloveneSomaliSouth AfricanSouth AmericanSouth American IndianSoviet UnionSpaniardSpanishSpanish AmericanSpanish American IndianSri LankanSubsaharan AfricanSudaneseSwedishSwissSyrianTaiwaneseThaiTlingit-HaidaTohono O'OdhamTonganTrinidadian and TobagonianTsimshianTurkishU.S. Virgin IslanderUgandanUkrainianUruguayanUteVenezuelanVietnameseWelshWest IndianYakamaYaquiYugoslavianYumanYup'ikZimbabwean
Immigration
NonimmigrantsImmigrantsAfghanistanAfricaAlbaniaArgentinaArmeniaAsiaAustraliaAustriaBahamasBangladeshBarbadosBelarusBelgiumBelizeBoliviaBosnia and HerzegovinaBrazilBulgariaBurma/MyanmarCabo VerdeCambodiaCameroonCanadaCaribbeanCentral AmericaChileChinaColombiaCongoCosta RicaCroatiaCubaCzechoslovakiaDenmarkDominicaDominican RepublicEastern AfricaEastern AsiaEastern EuropeEcuadorEgyptEl SalvadorEnglandEritreaEthiopiaEuropeFijiFranceGermanyGhanaGreeceGrenadaGuatemalaGuyanaHaitiHondurasHong KongHungaryIndiaIndonesiaIranIraqIrelandIsraelItalyJamaicaJapanJordanKazakhstanKenyaKoreaKuwaitLaosLatin AmericaLatviaLebanonLiberiaLithuaniaMalaysiaMexicoMicronesiaMiddle AfricaMoldovaMoroccoNepalNetherlandsNicaraguaNigeriaNorth AmericaNorth MacedoniaNorthern AfricaNorthern EuropeNorwayOceaniaPakistanPanamaPeruPhilippinesPolandPortugalRomaniaRussiaSaudi ArabiaScotlandSenegalSerbiaSierra LeoneSingaporeSomaliaSouth AfricaSouth AmericaSouth Central AsiaSouth Eastern AsiaSouthern EuropeSpainSri LankaSt. Vincent and the GrenadinesSudanSwedenSwitzerlandSyriaTaiwanThailandTrinidad and TobagoTurkeyUgandaUkraineUruguayUzbekistanVenezuelaVietnamWest IndiesWestern AfricaWestern AsiaWestern EuropeYemenZaireZimbabweAzores
Self-Care Disability
Income
Poverty
Unemployment
Labor Participation
Family Structure
Vehicle Availability
Education Level
Disability

Latvian Self-Care Disability
Exceptional

2.3%
SELF-CARE DISABILITY
99.7/ 100
METRIC RATING
49th/ 347
METRIC RANK

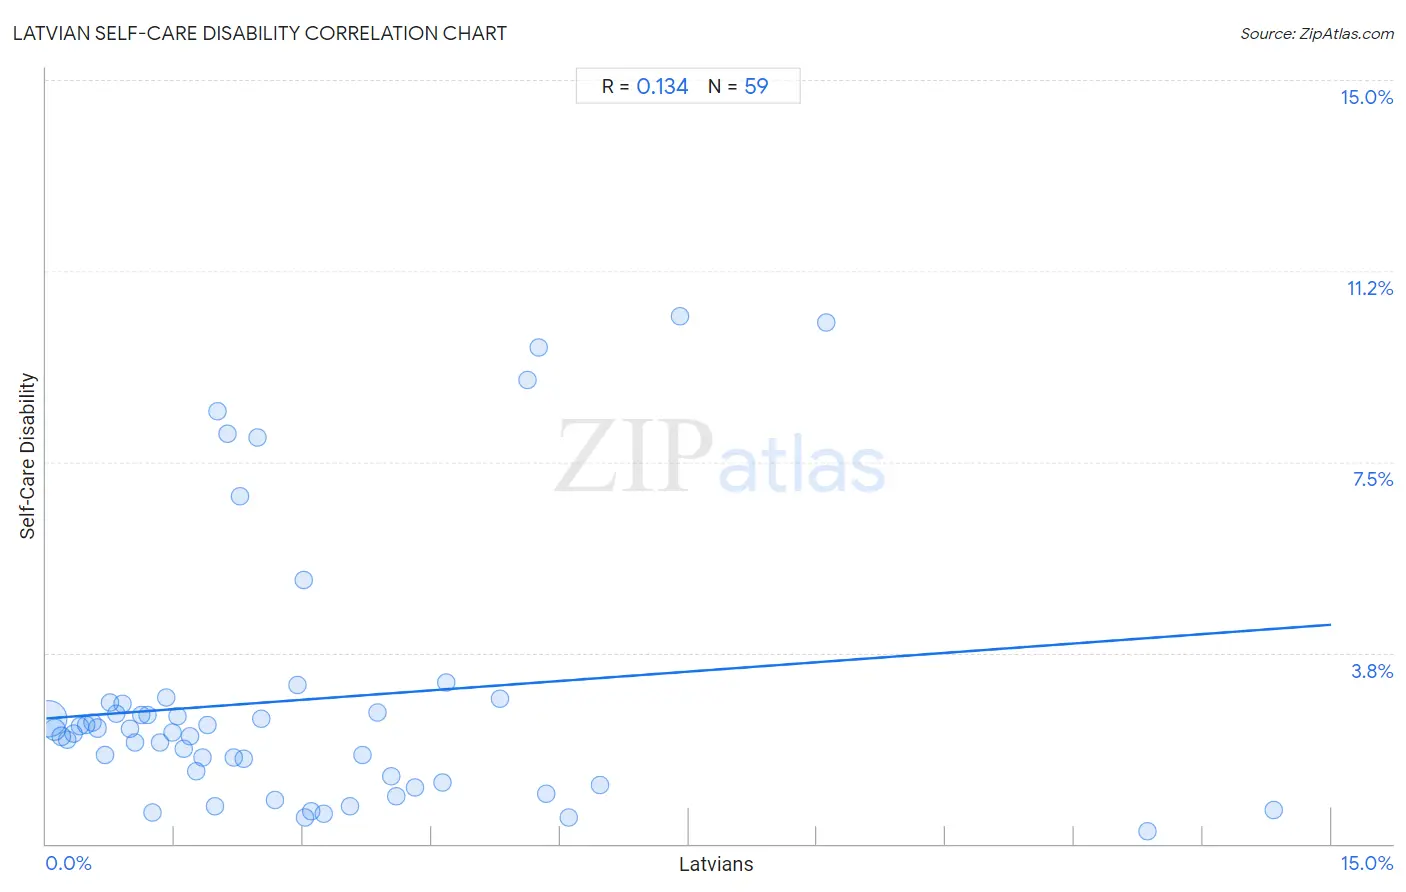
Latvian Self-Care Disability Correlation Chart

The statistical analysis conducted on geographies consisting of 220,536,730 people shows a poor positive correlation between the proportion of Latvians and percentage of population with self-care disability in the United States with a correlation coefficient (R) of 0.134 and weighted average of 2.3%. On average, for every 1% (one percent) increase in Latvians within a typical geography, there is an increase of 0.12% in percentage of population with self-care disability.
Latvian Self-Care Disability
It is essential to understand that the correlation between the percentage of Latvians and percentage of population with self-care disability does not imply a direct cause-and-effect relationship. It remains uncertain whether the presence of Latvians influences an upward or downward trend in the level of percentage of population with self-care disability within an area, or if Latvians simply ended up residing in those areas with higher or lower levels of percentage of population with self-care disability due to other factors.

Demographics Similar to Latvians by Self-Care Disability

In terms of self-care disability, the demographic groups most similar to Latvians are Immigrants from Brazil (2.3%, a difference of 0.020%), Immigrants from Malaysia (2.3%, a difference of 0.17%), Kenyan (2.3%, a difference of 0.17%), Immigrants from Serbia (2.3%, a difference of 0.19%), and Jordanian (2.3%, a difference of 0.22%).
DemographicsRating | RankSelf-Care Disability
Immigrants from Uganda
99.8
/100
|
#42
Exceptional
2.3%
Immigrants from Pakistan
99.8
/100
|
#43
Exceptional
2.3%
Immigrants from South Africa
99.8
/100
|
#44
Exceptional
2.3%
Norwegians
99.8
/100
|
#45
Exceptional
2.3%
Czechs
99.8
/100
|
#46
Exceptional
2.3%
Jordanians
99.7
/100
|
#47
Exceptional
2.3%
Immigrants from Malaysia
99.7
/100
|
#48
Exceptional
2.3%
Latvians
99.7
/100
|
#49
Exceptional
2.3%
Immigrants from Brazil
99.7
/100
|
#50
Exceptional
2.3%
Kenyans
99.7
/100
|
#51
Exceptional
2.3%
Immigrants from Serbia
99.6
/100
|
#52
Exceptional
2.3%
Australians
99.6
/100
|
#53
Exceptional
2.3%
Argentineans
99.6
/100
|
#54
Exceptional
2.3%
Immigrants from France
99.6
/100
|
#55
Exceptional
2.3%
Immigrants from Eastern Asia
99.6
/100
|
#56
Exceptional
2.3%

Latvian Self-Care Disability Correlation Summary

MeasurementLatvian DataSelf-Care Disability Data
Minimum0.030%0.23%
Maximum14.3%10.4%
Range14.3%10.1%
Mean2.9%2.8%
Median2.1%2.2%
Interquartile 25% (IQ1)1.0%1.2%
Interquartile 75% (IQ3)4.0%2.8%
Interquartile Range (IQR)3.0%1.6%
Standard Deviation (Sample)2.8%2.6%
Standard Deviation (Population)2.8%2.6%

Correlation Details

Latvian PercentileSample SizeSelf-Care Disability
[
0.0%
-
0.5%
]
0.030%
161,474,2472.5%
[
0.0%
-
0.5%
]
0.100%
37,586,1792.2%
[
0.0%
-
0.5%
]
0.17%
10,108,8862.1%
[
0.0%
-
0.5%
]
0.25%
4,598,9012.0%
[
0.0%
-
0.5%
]
0.32%
2,620,5302.2%
[
0.0%
-
0.5%
]
0.39%
1,352,5462.3%
[
0.0%
-
0.5%
]
0.47%
586,5792.3%
[
0.5%
-
1.0%
]
0.53%
606,6242.4%
[
0.5%
-
1.0%
]
0.60%
464,7162.3%
[
0.5%
-
1.0%
]
0.68%
284,7311.8%
[
0.5%
-
1.0%
]
0.75%
190,9832.8%
[
0.5%
-
1.0%
]
0.81%
87,2792.6%
[
0.5%
-
1.0%
]
0.89%
113,0772.8%
[
0.5%
-
1.0%
]
0.97%
76,6692.3%
[
1.0%
-
1.5%
]
1.03%
105,6262.0%
[
1.0%
-
1.5%
]
1.11%
10,5072.5%
[
1.0%
-
1.5%
]
1.18%
31,0712.5%
[
1.0%
-
1.5%
]
1.24%
5,8170.63%
[
1.0%
-
1.5%
]
1.33%
19,5032.0%
[
1.0%
-
1.5%
]
1.40%
20,3932.9%
[
1.0%
-
1.5%
]
1.48%
11,4932.2%
[
1.5%
-
2.0%
]
1.53%
45,6882.5%
[
1.5%
-
2.0%
]
1.61%
10,2101.9%
[
1.5%
-
2.0%
]
1.68%
12,5162.1%
[
1.5%
-
2.0%
]
1.75%
4,5021.4%
[
1.5%
-
2.0%
]
1.82%
9,3901.7%
[
1.5%
-
2.0%
]
1.88%
9,4352.3%
[
1.5%
-
2.0%
]
1.98%
13,5090.74%
[
2.0%
-
2.5%
]
2.01%
6488.5%
[
2.0%
-
2.5%
]
2.12%
3778.1%
[
2.0%
-
2.5%
]
2.19%
20,5291.7%
[
2.0%
-
2.5%
]
2.25%
3,9926.8%
[
2.0%
-
2.5%
]
2.31%
1,8611.7%
[
2.0%
-
2.5%
]
2.46%
1,1368.0%
[
2.5%
-
3.0%
]
2.51%
1,3922.5%
[
2.5%
-
3.0%
]
2.67%
13,4970.87%
[
2.5%
-
3.0%
]
2.94%
2,0103.1%
[
3.0%
-
3.5%
]
3.01%
1335.2%
[
3.0%
-
3.5%
]
3.03%
8,4250.52%
[
3.0%
-
3.5%
]
3.09%
1620.64%
[
3.0%
-
3.5%
]
3.23%
4020.58%
[
3.5%
-
4.0%
]
3.55%
7320.73%
[
3.5%
-
4.0%
]
3.69%
3521.7%
[
3.5%
-
4.0%
]
3.87%
1,4722.6%
[
4.0%
-
4.5%
]
4.03%
2,0361.3%
[
4.0%
-
4.5%
]
4.09%
2200.94%
[
4.0%
-
4.5%
]
4.31%
1,0911.1%
[
4.5%
-
5.0%
]
4.62%
2,1431.2%
[
4.5%
-
5.0%
]
4.67%
3003.2%
[
5.0%
-
5.5%
]
5.30%
7742.8%
[
5.5%
-
6.0%
]
5.62%
4,6119.1%
[
5.5%
-
6.0%
]
5.75%
2269.7%
[
5.5%
-
6.0%
]
5.83%
2230.99%
[
6.0%
-
6.5%
]
6.10%
7710.52%
[
6.0%
-
6.5%
]
6.46%
4491.2%
[
7.0%
-
7.5%
]
7.39%
2,31310.4%
[
9.0%
-
9.5%
]
9.11%
42810.2%
[
12.5%
-
13.0%
]
12.85%
4280.23%
[
14.0%
-
14.5%
]
14.32%
1,9900.67%