Indonesian Unemployment Among Women with Children Ages 6 to 17 years
COMPARE
Indonesian
Select to Compare
Unemployment Among Women with Children Ages 6 to 17 years
Indonesian Unemployment Among Women with Children Ages 6 to 17 years
7.4%
UNEMPLOYMENT | WOMEN W/ CHILDREN 6 TO 17
100.0/ 100
METRIC RATING
13th/ 347
METRIC RANK
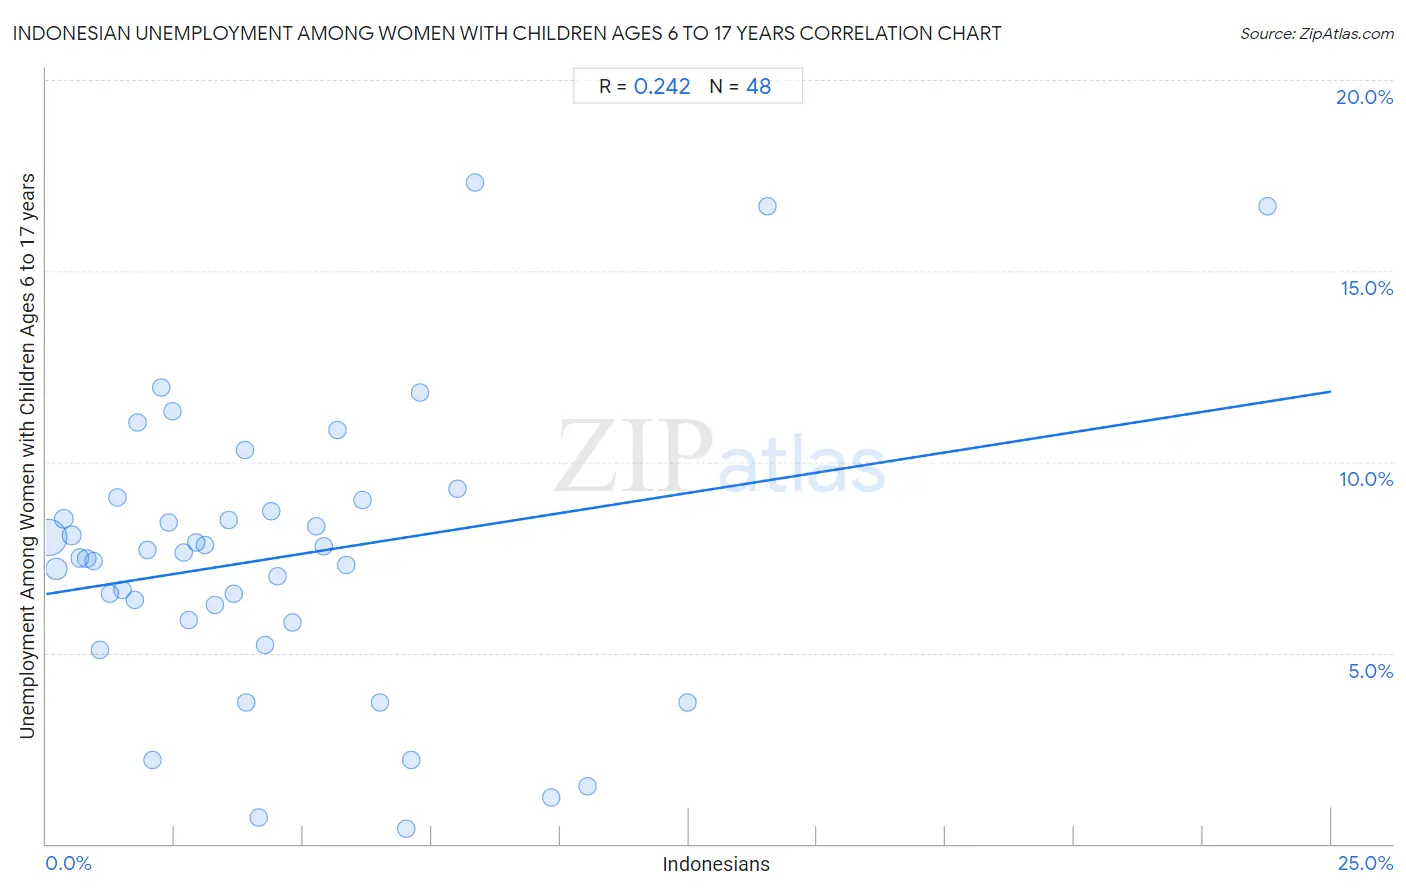
Indonesian Unemployment Among Women with Children Ages 6 to 17 years Correlation Chart
The statistical analysis conducted on geographies consisting of 136,569,357 people shows a weak positive correlation between the proportion of Indonesians and unemployment rate among women with children between the ages 6 and 17 in the United States with a correlation coefficient (R) of 0.242 and weighted average of 7.4%. On average, for every 1% (one percent) increase in Indonesians within a typical geography, there is an increase of 0.21% in unemployment rate among women with children between the ages 6 and 17.
It is essential to understand that the correlation between the percentage of Indonesians and unemployment rate among women with children between the ages 6 and 17 does not imply a direct cause-and-effect relationship. It remains uncertain whether the presence of Indonesians influences an upward or downward trend in the level of unemployment rate among women with children between the ages 6 and 17 within an area, or if Indonesians simply ended up residing in those areas with higher or lower levels of unemployment rate among women with children between the ages 6 and 17 due to other factors.
Demographics Similar to Indonesians by Unemployment Among Women with Children Ages 6 to 17 years
In terms of unemployment among women with children ages 6 to 17 years, the demographic groups most similar to Indonesians are Sudanese (7.4%, a difference of 0.040%), Bangladeshi (7.4%, a difference of 0.71%), Immigrants from Taiwan (7.3%, a difference of 1.0%), Puget Sound Salish (7.5%, a difference of 1.1%), and Immigrants from Burma/Myanmar (7.5%, a difference of 1.5%).
| Demographics | Rating | Rank | Unemployment Among Women with Children Ages 6 to 17 years |
| Tlingit-Haida | 100.0 /100 | #6 | Exceptional 7.1% |
| Soviet Union | 100.0 /100 | #7 | Exceptional 7.1% |
| Immigrants from Hong Kong | 100.0 /100 | #8 | Exceptional 7.2% |
| Assyrians/Chaldeans/Syriacs | 100.0 /100 | #9 | Exceptional 7.2% |
| Immigrants from Fiji | 100.0 /100 | #10 | Exceptional 7.3% |
| Immigrants from Taiwan | 100.0 /100 | #11 | Exceptional 7.3% |
| Bangladeshis | 100.0 /100 | #12 | Exceptional 7.4% |
| Indonesians | 100.0 /100 | #13 | Exceptional 7.4% |
| Sudanese | 100.0 /100 | #14 | Exceptional 7.4% |
| Puget Sound Salish | 100.0 /100 | #15 | Exceptional 7.5% |
| Immigrants from Burma/Myanmar | 100.0 /100 | #16 | Exceptional 7.5% |
| Cambodians | 100.0 /100 | #17 | Exceptional 7.5% |
| Afghans | 100.0 /100 | #18 | Exceptional 7.6% |
| Filipinos | 100.0 /100 | #19 | Exceptional 7.6% |
| Immigrants from Singapore | 100.0 /100 | #20 | Exceptional 7.7% |
Indonesian Unemployment Among Women with Children Ages 6 to 17 years Correlation Summary
| Measurement | Indonesian Data | Unemployment Among Women with Children Ages 6 to 17 years Data |
| Minimum | 0.051% | 0.40% |
| Maximum | 23.8% | 17.3% |
| Range | 23.7% | 16.9% |
| Mean | 4.5% | 7.5% |
| Median | 3.6% | 7.6% |
| Interquartile 25% (IQ1) | 1.7% | 5.8% |
| Interquartile 75% (IQ3) | 6.0% | 8.9% |
| Interquartile Range (IQR) | 4.2% | 3.0% |
| Standard Deviation (Sample) | 4.3% | 3.7% |
| Standard Deviation (Population) | 4.2% | 3.7% |
Correlation Details
| Indonesian Percentile | Sample Size | Unemployment Among Women with Children Ages 6 to 17 years |
[ 0.0% - 0.5% ] 0.051% | 98,105,765 | 8.0% |
[ 0.0% - 0.5% ] 0.20% | 18,149,805 | 7.2% |
[ 0.0% - 0.5% ] 0.35% | 5,794,538 | 8.5% |
[ 0.0% - 0.5% ] 0.50% | 2,412,403 | 8.1% |
[ 0.5% - 1.0% ] 0.65% | 1,818,724 | 7.5% |
[ 0.5% - 1.0% ] 0.79% | 1,558,518 | 7.5% |
[ 0.5% - 1.0% ] 0.92% | 1,712,268 | 7.4% |
[ 1.0% - 1.5% ] 1.05% | 1,107,566 | 5.1% |
[ 1.0% - 1.5% ] 1.23% | 451,518 | 6.5% |
[ 1.0% - 1.5% ] 1.38% | 925,830 | 9.1% |
[ 1.0% - 1.5% ] 1.47% | 395,726 | 6.7% |
[ 1.5% - 2.0% ] 1.72% | 948,166 | 6.4% |
[ 1.5% - 2.0% ] 1.78% | 184,881 | 11.0% |
[ 1.5% - 2.0% ] 1.96% | 467,933 | 7.7% |
[ 2.0% - 2.5% ] 2.08% | 187,560 | 2.2% |
[ 2.0% - 2.5% ] 2.23% | 105,603 | 12.0% |
[ 2.0% - 2.5% ] 2.38% | 152,073 | 8.4% |
[ 2.0% - 2.5% ] 2.46% | 35,940 | 11.3% |
[ 2.5% - 3.0% ] 2.67% | 228,830 | 7.6% |
[ 2.5% - 3.0% ] 2.78% | 72,465 | 5.9% |
[ 2.5% - 3.0% ] 2.92% | 24,028 | 7.9% |
[ 3.0% - 3.5% ] 3.09% | 65,629 | 7.8% |
[ 3.0% - 3.5% ] 3.27% | 631,524 | 6.2% |
[ 3.5% - 4.0% ] 3.55% | 64,635 | 8.5% |
[ 3.5% - 4.0% ] 3.65% | 77,110 | 6.5% |
[ 3.5% - 4.0% ] 3.87% | 31,047 | 10.3% |
[ 3.5% - 4.0% ] 3.90% | 26,896 | 3.7% |
[ 4.0% - 4.5% ] 4.14% | 38,441 | 0.70% |
[ 4.0% - 4.5% ] 4.25% | 72,385 | 5.2% |
[ 4.0% - 4.5% ] 4.38% | 81,764 | 8.7% |
[ 4.5% - 5.0% ] 4.51% | 20,135 | 7.0% |
[ 4.5% - 5.0% ] 4.80% | 31,715 | 5.8% |
[ 5.0% - 5.5% ] 5.24% | 39,743 | 8.3% |
[ 5.0% - 5.5% ] 5.40% | 31,976 | 7.8% |
[ 5.5% - 6.0% ] 5.66% | 124,490 | 10.8% |
[ 5.5% - 6.0% ] 5.85% | 26,156 | 7.3% |
[ 6.0% - 6.5% ] 6.14% | 79,880 | 9.0% |
[ 6.0% - 6.5% ] 6.50% | 15,899 | 3.7% |
[ 6.5% - 7.0% ] 6.99% | 25,699 | 0.40% |
[ 7.0% - 7.5% ] 7.11% | 23,980 | 2.2% |
[ 7.0% - 7.5% ] 7.28% | 19,447 | 11.8% |
[ 7.5% - 8.0% ] 8.00% | 40,152 | 9.3% |
[ 8.0% - 8.5% ] 8.35% | 24,684 | 17.3% |
[ 9.5% - 10.0% ] 9.84% | 37,834 | 1.2% |
[ 10.5% - 11.0% ] 10.54% | 56,794 | 1.5% |
[ 12.0% - 12.5% ] 12.48% | 19,613 | 3.7% |
[ 14.0% - 14.5% ] 14.02% | 19,501 | 16.7% |
[ 23.5% - 24.0% ] 23.75% | 2,088 | 16.7% |