Indonesian 4 or more Vehicles in Household
COMPARE
Indonesian
Select to Compare
4 or more Vehicles in Household
Indonesian 4 or more Vehicles in Household
6.0%
4+ VEHICLES AVAILABLE
8.9/ 100
METRIC RATING
225th/ 347
METRIC RANK
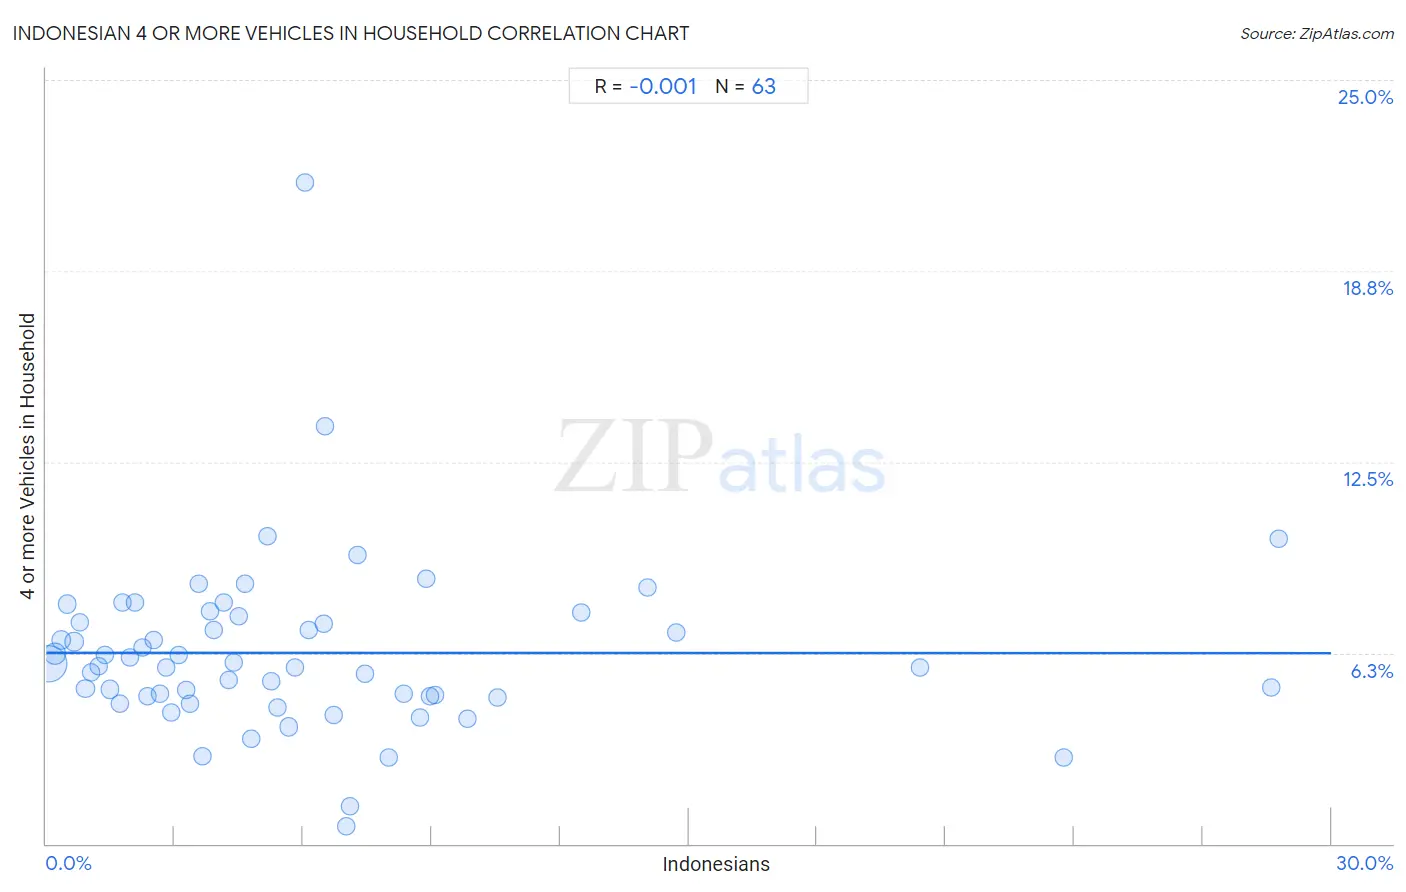
Indonesian 4 or more Vehicles in Household Correlation Chart
The statistical analysis conducted on geographies consisting of 162,278,246 people shows no correlation between the proportion of Indonesians and percentage of households with 4 or more vehicles available in the United States with a correlation coefficient (R) of -0.001 and weighted average of 6.0%. On average, for every 1% (one percent) increase in Indonesians within a typical geography, there is a decrease of 0.00042% in percentage of households with 4 or more vehicles available.
It is essential to understand that the correlation between the percentage of Indonesians and percentage of households with 4 or more vehicles available does not imply a direct cause-and-effect relationship. It remains uncertain whether the presence of Indonesians influences an upward or downward trend in the level of percentage of households with 4 or more vehicles available within an area, or if Indonesians simply ended up residing in those areas with higher or lower levels of percentage of households with 4 or more vehicles available due to other factors.
Demographics Similar to Indonesians by 4 or more Vehicles in Household
In terms of 4 or more vehicles in household, the demographic groups most similar to Indonesians are Cuban (6.0%, a difference of 0.080%), Cajun (6.0%, a difference of 0.090%), Immigrants from Kenya (6.0%, a difference of 0.090%), Immigrants from Moldova (6.0%, a difference of 0.13%), and Immigrants from Singapore (5.9%, a difference of 0.38%).
| Demographics | Rating | Rank | 4 or more Vehicles in Household |
| Immigrants from Italy | 11.0 /100 | #218 | Poor 6.0% |
| Serbians | 11.0 /100 | #219 | Poor 6.0% |
| Russians | 10.3 /100 | #220 | Poor 6.0% |
| Immigrants from Moldova | 9.3 /100 | #221 | Tragic 6.0% |
| Cajuns | 9.2 /100 | #222 | Tragic 6.0% |
| Immigrants from Kenya | 9.2 /100 | #223 | Tragic 6.0% |
| Cubans | 9.2 /100 | #224 | Tragic 6.0% |
| Indonesians | 8.9 /100 | #225 | Tragic 6.0% |
| Immigrants from Singapore | 7.9 /100 | #226 | Tragic 5.9% |
| Immigrants from Western Asia | 7.8 /100 | #227 | Tragic 5.9% |
| Immigrants from Uganda | 7.5 /100 | #228 | Tragic 5.9% |
| Eastern Europeans | 6.8 /100 | #229 | Tragic 5.9% |
| Immigrants from Malaysia | 6.7 /100 | #230 | Tragic 5.9% |
| Immigrants from Switzerland | 6.4 /100 | #231 | Tragic 5.9% |
| Immigrants from Argentina | 6.0 /100 | #232 | Tragic 5.9% |
Indonesian 4 or more Vehicles in Household Correlation Summary
| Measurement | Indonesian Data | 4 or more Vehicles in Household Data |
| Minimum | 0.052% | 0.59% |
| Maximum | 28.8% | 21.6% |
| Range | 28.7% | 21.0% |
| Mean | 6.1% | 6.2% |
| Median | 4.5% | 5.8% |
| Interquartile 25% (IQ1) | 2.2% | 4.8% |
| Interquartile 75% (IQ3) | 7.4% | 7.4% |
| Interquartile Range (IQR) | 5.2% | 2.6% |
| Standard Deviation (Sample) | 6.1% | 2.9% |
| Standard Deviation (Population) | 6.1% | 2.9% |
Correlation Details
| Indonesian Percentile | Sample Size | 4 or more Vehicles in Household |
[ 0.0% - 0.5% ] 0.052% | 112,155,620 | 5.9% |
[ 0.0% - 0.5% ] 0.20% | 22,987,784 | 6.2% |
[ 0.0% - 0.5% ] 0.35% | 7,726,597 | 6.7% |
[ 0.0% - 0.5% ] 0.49% | 3,610,434 | 7.9% |
[ 0.5% - 1.0% ] 0.65% | 2,546,011 | 6.6% |
[ 0.5% - 1.0% ] 0.79% | 2,004,488 | 7.2% |
[ 0.5% - 1.0% ] 0.92% | 2,203,350 | 5.1% |
[ 1.0% - 1.5% ] 1.06% | 1,347,724 | 5.6% |
[ 1.0% - 1.5% ] 1.23% | 608,620 | 5.8% |
[ 1.0% - 1.5% ] 1.38% | 1,126,432 | 6.2% |
[ 1.0% - 1.5% ] 1.48% | 520,197 | 5.1% |
[ 1.5% - 2.0% ] 1.71% | 1,144,191 | 4.6% |
[ 1.5% - 2.0% ] 1.79% | 338,926 | 7.9% |
[ 1.5% - 2.0% ] 1.95% | 590,482 | 6.1% |
[ 2.0% - 2.5% ] 2.09% | 252,350 | 7.9% |
[ 2.0% - 2.5% ] 2.24% | 204,084 | 6.4% |
[ 2.0% - 2.5% ] 2.37% | 177,523 | 4.8% |
[ 2.5% - 3.0% ] 2.51% | 107,823 | 6.7% |
[ 2.5% - 3.0% ] 2.66% | 335,856 | 4.9% |
[ 2.5% - 3.0% ] 2.81% | 125,821 | 5.8% |
[ 2.5% - 3.0% ] 2.92% | 27,709 | 4.3% |
[ 3.0% - 3.5% ] 3.09% | 100,868 | 6.2% |
[ 3.0% - 3.5% ] 3.27% | 637,470 | 5.1% |
[ 3.0% - 3.5% ] 3.34% | 46,923 | 4.6% |
[ 3.5% - 4.0% ] 3.55% | 84,706 | 8.5% |
[ 3.5% - 4.0% ] 3.66% | 124,609 | 2.9% |
[ 3.5% - 4.0% ] 3.82% | 74,686 | 7.6% |
[ 3.5% - 4.0% ] 3.91% | 32,995 | 7.0% |
[ 4.0% - 4.5% ] 4.14% | 41,235 | 7.9% |
[ 4.0% - 4.5% ] 4.25% | 72,643 | 5.4% |
[ 4.0% - 4.5% ] 4.38% | 87,012 | 5.9% |
[ 4.0% - 4.5% ] 4.50% | 37,068 | 7.4% |
[ 4.5% - 5.0% ] 4.64% | 25,872 | 8.5% |
[ 4.5% - 5.0% ] 4.79% | 47,355 | 3.4% |
[ 5.0% - 5.5% ] 5.17% | 2,321 | 10.1% |
[ 5.0% - 5.5% ] 5.25% | 52,384 | 5.3% |
[ 5.0% - 5.5% ] 5.40% | 32,443 | 4.5% |
[ 5.5% - 6.0% ] 5.66% | 125,697 | 3.8% |
[ 5.5% - 6.0% ] 5.82% | 50,035 | 5.8% |
[ 6.0% - 6.5% ] 6.03% | 879 | 21.6% |
[ 6.0% - 6.5% ] 6.14% | 79,880 | 7.0% |
[ 6.0% - 6.5% ] 6.47% | 14,553 | 7.2% |
[ 6.0% - 6.5% ] 6.50% | 15,899 | 13.7% |
[ 6.5% - 7.0% ] 6.70% | 26,684 | 4.2% |
[ 6.5% - 7.0% ] 6.99% | 25,699 | 0.59% |
[ 7.0% - 7.5% ] 7.11% | 23,980 | 1.2% |
[ 7.0% - 7.5% ] 7.28% | 19,447 | 9.5% |
[ 7.0% - 7.5% ] 7.44% | 900 | 5.6% |
[ 7.5% - 8.0% ] 8.00% | 40,641 | 2.8% |
[ 8.0% - 8.5% ] 8.35% | 24,684 | 4.9% |
[ 8.5% - 9.0% ] 8.71% | 1,377 | 4.1% |
[ 8.5% - 9.0% ] 8.87% | 2,029 | 8.7% |
[ 8.5% - 9.0% ] 8.97% | 3,055 | 4.8% |
[ 9.0% - 9.5% ] 9.08% | 3,019 | 4.9% |
[ 9.5% - 10.0% ] 9.84% | 37,834 | 4.1% |
[ 10.5% - 11.0% ] 10.54% | 56,794 | 4.8% |
[ 12.0% - 12.5% ] 12.48% | 19,701 | 7.6% |
[ 14.0% - 14.5% ] 14.02% | 19,501 | 8.4% |
[ 14.5% - 15.0% ] 14.70% | 39,082 | 6.9% |
[ 20.0% - 20.5% ] 20.39% | 1,035 | 5.8% |
[ 23.5% - 24.0% ] 23.75% | 2,088 | 2.8% |
[ 28.5% - 29.0% ] 28.59% | 738 | 5.1% |
[ 28.5% - 29.0% ] 28.78% | 403 | 10.0% |