Indonesian Self-Care Disability

COMPARE

Indonesian
Race
Ancestry
AfghanAfricanAlaska NativeAlaskan AthabascanAlbanianAleutAlsatianAmericanApacheArabArapahoArgentineanArmenianAssyrian/Chaldean/SyriacAustralianAustrianBahamianBangladeshiBarbadianBasqueBelgianBelizeanBermudanBhutaneseBlackfeetBolivianBrazilianBritishBritish West IndianBulgarianBurmeseCajunCambodianCanadianCape VerdeanCarpatho RusynCelticCentral AmericanCentral American IndianCherokeeCheyenneChickasawChileanChineseChippewaChoctawColombianColvilleComancheCosta RicanCreeCreekCroatianCrowCubanCypriotCzechCzechoslovakianDanishDelawareDominicanDutchDutch West IndianEastern EuropeanEcuadorianEgyptianEnglishEstonianEthiopianEuropeanFijianFilipinoFinnishFrenchFrench American IndianFrench CanadianGermanGerman RussianGhanaianGreekGuamanian/ChamorroGuatemalanGuyaneseHaitianHmongHonduranHopiHoumaHungarianIcelanderIndian (Asian)IndonesianInupiatIranianIraqiIrishIroquoisIsraeliItalianJamaicanJapaneseJordanianKenyanKiowaKoreanLaotianLatvianLebaneseLiberianLithuanianLumbeeLuxembourgerMacedonianMalaysianMalteseMarshalleseMenomineeMexicanMexican American IndianMongolianMoroccanNative HawaiianNavajoNepaleseNew ZealanderNicaraguanNigerianNorthern EuropeanNorwegianOkinawanOsageOttawaPaiutePakistaniPalestinianPanamanianParaguayanPennsylvania GermanPeruvianPimaPolishPortuguesePotawatomiPuebloPuerto RicanPuget Sound SalishRomanianRussianSalvadoranSamoanScandinavianScotch-IrishScottishSeminoleSenegaleseSerbianShoshoneSierra LeoneanSiouxSlavicSlovakSloveneSomaliSouth AfricanSouth AmericanSouth American IndianSoviet UnionSpaniardSpanishSpanish AmericanSpanish American IndianSri LankanSubsaharan AfricanSudaneseSwedishSwissSyrianTaiwaneseThaiTlingit-HaidaTohono O'OdhamTonganTrinidadian and TobagonianTsimshianTurkishU.S. Virgin IslanderUgandanUkrainianUruguayanUteVenezuelanVietnameseWelshWest IndianYakamaYaquiYugoslavianYumanYup'ikZimbabwean
Immigration
NonimmigrantsImmigrantsAfghanistanAfricaAlbaniaArgentinaArmeniaAsiaAustraliaAustriaBahamasBangladeshBarbadosBelarusBelgiumBelizeBoliviaBosnia and HerzegovinaBrazilBulgariaBurma/MyanmarCabo VerdeCambodiaCameroonCanadaCaribbeanCentral AmericaChileChinaColombiaCongoCosta RicaCroatiaCubaCzechoslovakiaDenmarkDominicaDominican RepublicEastern AfricaEastern AsiaEastern EuropeEcuadorEgyptEl SalvadorEnglandEritreaEthiopiaEuropeFijiFranceGermanyGhanaGreeceGrenadaGuatemalaGuyanaHaitiHondurasHong KongHungaryIndiaIndonesiaIranIraqIrelandIsraelItalyJamaicaJapanJordanKazakhstanKenyaKoreaKuwaitLaosLatin AmericaLatviaLebanonLiberiaLithuaniaMalaysiaMexicoMicronesiaMiddle AfricaMoldovaMoroccoNepalNetherlandsNicaraguaNigeriaNorth AmericaNorth MacedoniaNorthern AfricaNorthern EuropeNorwayOceaniaPakistanPanamaPeruPhilippinesPolandPortugalRomaniaRussiaSaudi ArabiaScotlandSenegalSerbiaSierra LeoneSingaporeSomaliaSouth AfricaSouth AmericaSouth Central AsiaSouth Eastern AsiaSouthern EuropeSpainSri LankaSt. Vincent and the GrenadinesSudanSwedenSwitzerlandSyriaTaiwanThailandTrinidad and TobagoTurkeyUgandaUkraineUruguayUzbekistanVenezuelaVietnamWest IndiesWestern AfricaWestern AsiaWestern EuropeYemenZaireZimbabweAzores
Select to Compare
Race
Ancestry
AfghanAfricanAlaska NativeAlaskan AthabascanAlbanianAleutAlsatianAmericanApacheArabArapahoArgentineanArmenianAssyrian/Chaldean/SyriacAustralianAustrianBahamianBangladeshiBarbadianBasqueBelgianBelizeanBermudanBhutaneseBlackfeetBolivianBrazilianBritishBritish West IndianBulgarianBurmeseCajunCambodianCanadianCape VerdeanCarpatho RusynCelticCentral AmericanCentral American IndianCherokeeCheyenneChickasawChileanChineseChippewaChoctawColombianColvilleComancheCosta RicanCreeCreekCroatianCrowCubanCypriotCzechCzechoslovakianDanishDelawareDominicanDutchDutch West IndianEastern EuropeanEcuadorianEgyptianEnglishEstonianEthiopianEuropeanFijianFilipinoFinnishFrenchFrench American IndianFrench CanadianGermanGerman RussianGhanaianGreekGuamanian/ChamorroGuatemalanGuyaneseHaitianHmongHonduranHopiHoumaHungarianIcelanderIndian (Asian)InupiatIranianIraqiIrishIroquoisIsraeliItalianJamaicanJapaneseJordanianKenyanKiowaKoreanLaotianLatvianLebaneseLiberianLithuanianLumbeeLuxembourgerMacedonianMalaysianMalteseMarshalleseMenomineeMexicanMexican American IndianMongolianMoroccanNative HawaiianNavajoNepaleseNew ZealanderNicaraguanNigerianNorthern EuropeanNorwegianOkinawanOsageOttawaPaiutePakistaniPalestinianPanamanianParaguayanPennsylvania GermanPeruvianPimaPolishPortuguesePotawatomiPuebloPuerto RicanPuget Sound SalishRomanianRussianSalvadoranSamoanScandinavianScotch-IrishScottishSeminoleSenegaleseSerbianShoshoneSierra LeoneanSiouxSlavicSlovakSloveneSomaliSouth AfricanSouth AmericanSouth American IndianSoviet UnionSpaniardSpanishSpanish AmericanSpanish American IndianSri LankanSubsaharan AfricanSudaneseSwedishSwissSyrianTaiwaneseThaiTlingit-HaidaTohono O'OdhamTonganTrinidadian and TobagonianTsimshianTurkishU.S. Virgin IslanderUgandanUkrainianUruguayanUteVenezuelanVietnameseWelshWest IndianYakamaYaquiYugoslavianYumanYup'ikZimbabwean
Immigration
NonimmigrantsImmigrantsAfghanistanAfricaAlbaniaArgentinaArmeniaAsiaAustraliaAustriaBahamasBangladeshBarbadosBelarusBelgiumBelizeBoliviaBosnia and HerzegovinaBrazilBulgariaBurma/MyanmarCabo VerdeCambodiaCameroonCanadaCaribbeanCentral AmericaChileChinaColombiaCongoCosta RicaCroatiaCubaCzechoslovakiaDenmarkDominicaDominican RepublicEastern AfricaEastern AsiaEastern EuropeEcuadorEgyptEl SalvadorEnglandEritreaEthiopiaEuropeFijiFranceGermanyGhanaGreeceGrenadaGuatemalaGuyanaHaitiHondurasHong KongHungaryIndiaIndonesiaIranIraqIrelandIsraelItalyJamaicaJapanJordanKazakhstanKenyaKoreaKuwaitLaosLatin AmericaLatviaLebanonLiberiaLithuaniaMalaysiaMexicoMicronesiaMiddle AfricaMoldovaMoroccoNepalNetherlandsNicaraguaNigeriaNorth AmericaNorth MacedoniaNorthern AfricaNorthern EuropeNorwayOceaniaPakistanPanamaPeruPhilippinesPolandPortugalRomaniaRussiaSaudi ArabiaScotlandSenegalSerbiaSierra LeoneSingaporeSomaliaSouth AfricaSouth AmericaSouth Central AsiaSouth Eastern AsiaSouthern EuropeSpainSri LankaSt. Vincent and the GrenadinesSudanSwedenSwitzerlandSyriaTaiwanThailandTrinidad and TobagoTurkeyUgandaUkraineUruguayUzbekistanVenezuelaVietnamWest IndiesWestern AfricaWestern AsiaWestern EuropeYemenZaireZimbabweAzores
Self-Care Disability
Income
Poverty
Unemployment
Labor Participation
Family Structure
Vehicle Availability
Education Level
Disability

Indonesian Self-Care Disability
Average

2.5%
SELF-CARE DISABILITY
41.2/ 100
METRIC RATING
180th/ 347
METRIC RANK

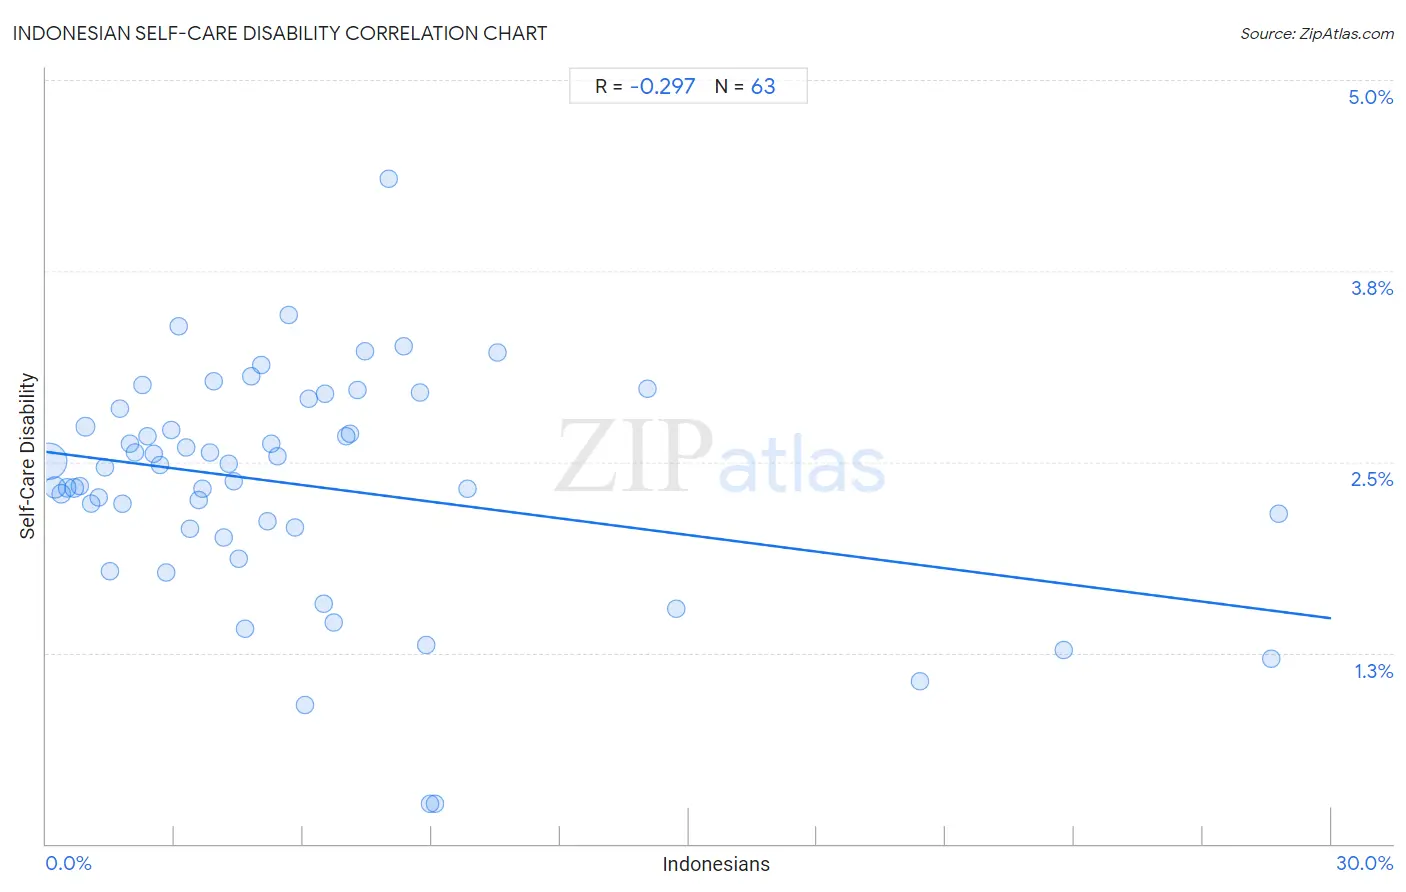
Indonesian Self-Care Disability Correlation Chart

The statistical analysis conducted on geographies consisting of 162,620,981 people shows a weak negative correlation between the proportion of Indonesians and percentage of population with self-care disability in the United States with a correlation coefficient (R) of -0.297 and weighted average of 2.5%. On average, for every 1% (one percent) increase in Indonesians within a typical geography, there is a decrease of 0.036% in percentage of population with self-care disability.
Indonesian Self-Care Disability
It is essential to understand that the correlation between the percentage of Indonesians and percentage of population with self-care disability does not imply a direct cause-and-effect relationship. It remains uncertain whether the presence of Indonesians influences an upward or downward trend in the level of percentage of population with self-care disability within an area, or if Indonesians simply ended up residing in those areas with higher or lower levels of percentage of population with self-care disability due to other factors.

Demographics Similar to Indonesians by Self-Care Disability

In terms of self-care disability, the demographic groups most similar to Indonesians are Ghanaian (2.5%, a difference of 0.040%), Maltese (2.5%, a difference of 0.19%), Hungarian (2.5%, a difference of 0.21%), English (2.5%, a difference of 0.24%), and Salvadoran (2.5%, a difference of 0.24%).
DemographicsRating | RankSelf-Care Disability
Immigrants from Burma/Myanmar
52.8
/100
|
#173
Average
2.5%
Welsh
50.0
/100
|
#174
Average
2.5%
Immigrants from Bosnia and Herzegovina
49.6
/100
|
#175
Average
2.5%
Immigrants from Afghanistan
47.6
/100
|
#176
Average
2.5%
Immigrants from Kazakhstan
46.7
/100
|
#177
Average
2.5%
English
46.2
/100
|
#178
Average
2.5%
Hungarians
45.5
/100
|
#179
Average
2.5%
Indonesians
41.2
/100
|
#180
Average
2.5%
Ghanaians
40.4
/100
|
#181
Average
2.5%
Maltese
37.5
/100
|
#182
Fair
2.5%
Salvadorans
36.4
/100
|
#183
Fair
2.5%
Yugoslavians
36.1
/100
|
#184
Fair
2.5%
Slavs
34.3
/100
|
#185
Fair
2.5%
Immigrants from El Salvador
33.0
/100
|
#186
Fair
2.5%
Irish
28.7
/100
|
#187
Fair
2.5%

Indonesian Self-Care Disability Correlation Summary

MeasurementIndonesian DataSelf-Care Disability Data
Minimum0.052%0.26%
Maximum28.8%4.4%
Range28.7%4.1%
Mean6.0%2.3%
Median4.5%2.5%
Interquartile 25% (IQ1)2.2%2.1%
Interquartile 75% (IQ3)7.3%2.8%
Interquartile Range (IQR)5.0%0.79%
Standard Deviation (Sample)6.1%0.74%
Standard Deviation (Population)6.0%0.74%

Correlation Details

Indonesian PercentileSample SizeSelf-Care Disability
[
0.0%
-
0.5%
]
0.052%
112,372,0862.5%
[
0.0%
-
0.5%
]
0.20%
23,020,7032.3%
[
0.0%
-
0.5%
]
0.35%
7,758,2802.3%
[
0.0%
-
0.5%
]
0.49%
3,608,5622.3%
[
0.5%
-
1.0%
]
0.65%
2,605,8802.3%
[
0.5%
-
1.0%
]
0.79%
2,004,4882.3%
[
0.5%
-
1.0%
]
0.92%
2,203,3502.7%
[
1.0%
-
1.5%
]
1.06%
1,347,7242.2%
[
1.0%
-
1.5%
]
1.23%
619,8992.3%
[
1.0%
-
1.5%
]
1.38%
1,126,4322.5%
[
1.0%
-
1.5%
]
1.48%
520,1971.8%
[
1.5%
-
2.0%
]
1.71%
1,143,8352.8%
[
1.5%
-
2.0%
]
1.79%
342,5482.2%
[
1.5%
-
2.0%
]
1.95%
590,4822.6%
[
2.0%
-
2.5%
]
2.09%
252,3502.6%
[
2.0%
-
2.5%
]
2.24%
206,1633.0%
[
2.0%
-
2.5%
]
2.37%
177,5232.7%
[
2.5%
-
3.0%
]
2.51%
107,8232.6%
[
2.5%
-
3.0%
]
2.66%
338,4162.5%
[
2.5%
-
3.0%
]
2.81%
126,8911.8%
[
2.5%
-
3.0%
]
2.92%
27,7092.7%
[
3.0%
-
3.5%
]
3.09%
100,8683.4%
[
3.0%
-
3.5%
]
3.27%
638,4522.6%
[
3.0%
-
3.5%
]
3.34%
46,9232.1%
[
3.5%
-
4.0%
]
3.55%
84,7062.3%
[
3.5%
-
4.0%
]
3.66%
124,6092.3%
[
3.5%
-
4.0%
]
3.82%
74,6862.6%
[
3.5%
-
4.0%
]
3.91%
32,9953.0%
[
4.0%
-
4.5%
]
4.14%
41,2352.0%
[
4.0%
-
4.5%
]
4.25%
72,6432.5%
[
4.0%
-
4.5%
]
4.38%
87,0122.4%
[
4.0%
-
4.5%
]
4.50%
37,0681.9%
[
4.5%
-
5.0%
]
4.64%
25,8721.4%
[
4.5%
-
5.0%
]
4.79%
47,3553.1%
[
5.0%
-
5.5%
]
5.01%
2,1353.1%
[
5.0%
-
5.5%
]
5.17%
2,3212.1%
[
5.0%
-
5.5%
]
5.25%
52,3842.6%
[
5.0%
-
5.5%
]
5.40%
32,4432.5%
[
5.5%
-
6.0%
]
5.66%
125,6973.5%
[
5.5%
-
6.0%
]
5.82%
50,0352.1%
[
6.0%
-
6.5%
]
6.03%
8790.90%
[
6.0%
-
6.5%
]
6.14%
79,8802.9%
[
6.0%
-
6.5%
]
6.47%
14,5531.6%
[
6.0%
-
6.5%
]
6.50%
15,8992.9%
[
6.5%
-
7.0%
]
6.70%
26,6841.4%
[
6.5%
-
7.0%
]
6.99%
25,6992.7%
[
7.0%
-
7.5%
]
7.11%
23,9802.7%
[
7.0%
-
7.5%
]
7.28%
19,4473.0%
[
7.0%
-
7.5%
]
7.44%
9003.2%
[
7.5%
-
8.0%
]
8.00%
40,6414.4%
[
8.0%
-
8.5%
]
8.35%
24,6843.3%
[
8.5%
-
9.0%
]
8.71%
1,3773.0%
[
8.5%
-
9.0%
]
8.87%
2,0291.3%
[
8.5%
-
9.0%
]
8.97%
3,0550.26%
[
9.0%
-
9.5%
]
9.08%
3,0190.26%
[
9.5%
-
10.0%
]
9.84%
37,8342.3%
[
10.5%
-
11.0%
]
10.54%
56,7943.2%
[
14.0%
-
14.5%
]
14.02%
19,5013.0%
[
14.5%
-
15.0%
]
14.70%
39,0821.5%
[
20.0%
-
20.5%
]
20.39%
1,0351.1%
[
23.5%
-
24.0%
]
23.75%
2,0881.3%
[
28.5%
-
29.0%
]
28.59%
7381.2%
[
28.5%
-
29.0%
]
28.78%
4032.2%