Indonesian 2 or more Vehicles in Household
COMPARE
Indonesian
Select to Compare
2 or more Vehicles in Household
Indonesian 2 or more Vehicles in Household
53.4%
2+ VEHICLES AVAILABLE
2.7/ 100
METRIC RATING
236th/ 347
METRIC RANK
Indonesian 2 or more Vehicles in Household Correlation Chart
The statistical analysis conducted on geographies consisting of 162,658,811 people shows a mild positive correlation between the proportion of Indonesians and percentage of households with 2 or more vehicles available in the United States with a correlation coefficient (R) of 0.332 and weighted average of 53.4%. On average, for every 1% (one percent) increase in Indonesians within a typical geography, there is an increase of 0.71% in percentage of households with 2 or more vehicles available.
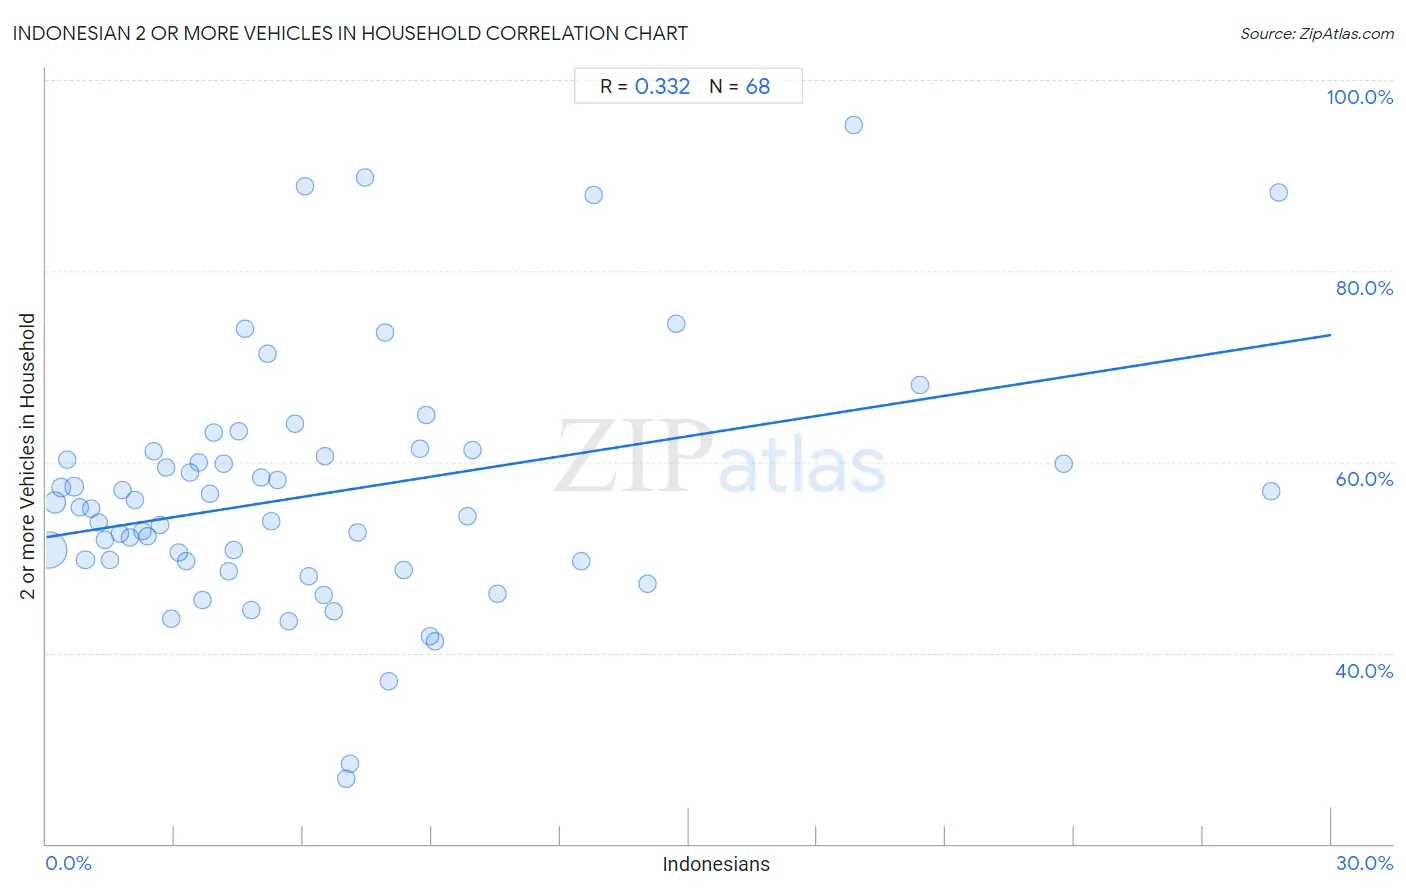
It is essential to understand that the correlation between the percentage of Indonesians and percentage of households with 2 or more vehicles available does not imply a direct cause-and-effect relationship. It remains uncertain whether the presence of Indonesians influences an upward or downward trend in the level of percentage of households with 2 or more vehicles available within an area, or if Indonesians simply ended up residing in those areas with higher or lower levels of percentage of households with 2 or more vehicles available due to other factors.
Demographics Similar to Indonesians by 2 or more Vehicles in Household
In terms of 2 or more vehicles in household, the demographic groups most similar to Indonesians are Immigrants from Middle Africa (53.4%, a difference of 0.10%), Macedonian (53.3%, a difference of 0.11%), Immigrants from Switzerland (53.4%, a difference of 0.13%), Ugandan (53.5%, a difference of 0.18%), and Immigrants from Armenia (53.3%, a difference of 0.18%).
| Demographics | Rating | Rank | 2 or more Vehicles in Household |
| Immigrants from Turkey | 3.8 /100 | #229 | Tragic 53.6% |
| Immigrants from Nepal | 3.6 /100 | #230 | Tragic 53.5% |
| Panamanians | 3.4 /100 | #231 | Tragic 53.5% |
| Immigrants from Guatemala | 3.2 /100 | #232 | Tragic 53.5% |
| Ugandans | 3.2 /100 | #233 | Tragic 53.5% |
| Immigrants from Switzerland | 3.0 /100 | #234 | Tragic 53.4% |
| Immigrants from Middle Africa | 3.0 /100 | #235 | Tragic 53.4% |
| Indonesians | 2.7 /100 | #236 | Tragic 53.4% |
| Macedonians | 2.4 /100 | #237 | Tragic 53.3% |
| Immigrants from Armenia | 2.3 /100 | #238 | Tragic 53.3% |
| Cambodians | 2.3 /100 | #239 | Tragic 53.3% |
| Immigrants from Europe | 2.1 /100 | #240 | Tragic 53.2% |
| Immigrants from Sierra Leone | 2.1 /100 | #241 | Tragic 53.2% |
| Immigrants from Eastern Asia | 2.1 /100 | #242 | Tragic 53.2% |
| Ethiopians | 1.7 /100 | #243 | Tragic 53.1% |
Indonesian 2 or more Vehicles in Household Correlation Summary
| Measurement | Indonesian Data | 2 or more Vehicles in Household Data |
| Minimum | 0.052% | 26.8% |
| Maximum | 28.8% | 95.3% |
| Range | 28.7% | 68.6% |
| Mean | 6.5% | 56.7% |
| Median | 4.9% | 55.1% |
| Interquartile 25% (IQ1) | 2.4% | 49.6% |
| Interquartile 75% (IQ3) | 8.2% | 60.8% |
| Interquartile Range (IQR) | 5.7% | 11.2% |
| Standard Deviation (Sample) | 6.2% | 13.1% |
| Standard Deviation (Population) | 6.1% | 13.0% |
Correlation Details
| Indonesian Percentile | Sample Size | 2 or more Vehicles in Household |
[ 0.0% - 0.5% ] 0.052% | 112,366,957 | 50.8% |
[ 0.0% - 0.5% ] 0.20% | 23,034,667 | 55.7% |
[ 0.0% - 0.5% ] 0.35% | 7,756,649 | 57.4% |
[ 0.0% - 0.5% ] 0.49% | 3,621,992 | 60.3% |
[ 0.5% - 1.0% ] 0.65% | 2,601,087 | 57.4% |
[ 0.5% - 1.0% ] 0.79% | 2,004,488 | 55.2% |
[ 0.5% - 1.0% ] 0.92% | 2,203,350 | 49.7% |
[ 1.0% - 1.5% ] 1.06% | 1,347,724 | 55.1% |
[ 1.0% - 1.5% ] 1.23% | 619,899 | 53.6% |
[ 1.0% - 1.5% ] 1.38% | 1,126,432 | 51.8% |
[ 1.0% - 1.5% ] 1.48% | 520,197 | 49.8% |
[ 1.5% - 2.0% ] 1.71% | 1,144,191 | 52.5% |
[ 1.5% - 2.0% ] 1.79% | 342,548 | 57.0% |
[ 1.5% - 2.0% ] 1.95% | 590,482 | 52.1% |
[ 2.0% - 2.5% ] 2.09% | 252,350 | 56.1% |
[ 2.0% - 2.5% ] 2.24% | 206,163 | 52.8% |
[ 2.0% - 2.5% ] 2.37% | 177,523 | 52.3% |
[ 2.5% - 3.0% ] 2.51% | 107,823 | 61.1% |
[ 2.5% - 3.0% ] 2.66% | 338,416 | 53.4% |
[ 2.5% - 3.0% ] 2.81% | 126,891 | 59.5% |
[ 2.5% - 3.0% ] 2.92% | 27,709 | 43.6% |
[ 3.0% - 3.5% ] 3.09% | 100,868 | 50.5% |
[ 3.0% - 3.5% ] 3.27% | 639,406 | 49.7% |
[ 3.0% - 3.5% ] 3.34% | 46,923 | 58.9% |
[ 3.5% - 4.0% ] 3.55% | 84,706 | 60.0% |
[ 3.5% - 4.0% ] 3.66% | 124,609 | 45.5% |
[ 3.5% - 4.0% ] 3.82% | 74,686 | 56.7% |
[ 3.5% - 4.0% ] 3.91% | 32,995 | 63.1% |
[ 4.0% - 4.5% ] 4.14% | 41,235 | 59.7% |
[ 4.0% - 4.5% ] 4.25% | 72,643 | 48.5% |
[ 4.0% - 4.5% ] 4.38% | 87,012 | 50.8% |
[ 4.0% - 4.5% ] 4.50% | 37,068 | 63.2% |
[ 4.5% - 5.0% ] 4.64% | 25,872 | 73.9% |
[ 4.5% - 5.0% ] 4.79% | 47,355 | 44.5% |
[ 5.0% - 5.5% ] 5.01% | 2,135 | 58.4% |
[ 5.0% - 5.5% ] 5.17% | 2,321 | 71.3% |
[ 5.0% - 5.5% ] 5.25% | 52,384 | 53.8% |
[ 5.0% - 5.5% ] 5.40% | 32,443 | 58.1% |
[ 5.5% - 6.0% ] 5.66% | 125,697 | 43.3% |
[ 5.5% - 6.0% ] 5.82% | 50,035 | 64.0% |
[ 6.0% - 6.5% ] 6.03% | 879 | 88.8% |
[ 6.0% - 6.5% ] 6.14% | 79,880 | 48.0% |
[ 6.0% - 6.5% ] 6.47% | 14,553 | 46.1% |
[ 6.0% - 6.5% ] 6.50% | 15,899 | 60.6% |
[ 6.5% - 7.0% ] 6.70% | 26,684 | 44.4% |
[ 6.5% - 7.0% ] 6.99% | 25,699 | 26.8% |
[ 7.0% - 7.5% ] 7.11% | 23,980 | 28.4% |
[ 7.0% - 7.5% ] 7.28% | 19,447 | 52.7% |
[ 7.0% - 7.5% ] 7.44% | 900 | 89.8% |
[ 7.5% - 8.0% ] 7.91% | 139 | 73.6% |
[ 7.5% - 8.0% ] 8.00% | 40,641 | 37.0% |
[ 8.0% - 8.5% ] 8.35% | 24,684 | 48.6% |
[ 8.5% - 9.0% ] 8.71% | 1,377 | 61.4% |
[ 8.5% - 9.0% ] 8.87% | 2,029 | 65.0% |
[ 8.5% - 9.0% ] 8.97% | 3,055 | 41.8% |
[ 9.0% - 9.5% ] 9.08% | 3,019 | 41.2% |
[ 9.5% - 10.0% ] 9.84% | 37,834 | 54.3% |
[ 9.5% - 10.0% ] 9.95% | 382 | 61.3% |
[ 10.5% - 11.0% ] 10.54% | 56,794 | 46.2% |
[ 12.0% - 12.5% ] 12.48% | 19,701 | 49.6% |
[ 12.5% - 13.0% ] 12.78% | 266 | 87.9% |
[ 14.0% - 14.5% ] 14.02% | 19,501 | 47.2% |
[ 14.5% - 15.0% ] 14.70% | 39,082 | 74.5% |
[ 18.5% - 19.0% ] 18.85% | 191 | 95.3% |
[ 20.0% - 20.5% ] 20.39% | 1,035 | 68.1% |
[ 23.5% - 24.0% ] 23.75% | 2,088 | 59.8% |
[ 28.5% - 29.0% ] 28.59% | 738 | 56.9% |
[ 28.5% - 29.0% ] 28.78% | 403 | 88.2% |