Indonesian Disability Age Under 5

COMPARE

Indonesian
Race
Ancestry
AfghanAfricanAlaska NativeAlaskan AthabascanAlbanianAleutAlsatianAmericanApacheArabArapahoArgentineanArmenianAssyrian/Chaldean/SyriacAustralianAustrianBahamianBangladeshiBarbadianBasqueBelgianBelizeanBermudanBhutaneseBlackfeetBolivianBrazilianBritishBritish West IndianBulgarianBurmeseCajunCambodianCanadianCape VerdeanCarpatho RusynCelticCentral AmericanCentral American IndianCherokeeCheyenneChickasawChileanChineseChippewaChoctawColombianColvilleComancheCosta RicanCreeCreekCroatianCrowCubanCypriotCzechCzechoslovakianDanishDelawareDominicanDutchDutch West IndianEastern EuropeanEcuadorianEgyptianEnglishEstonianEthiopianEuropeanFijianFilipinoFinnishFrenchFrench American IndianFrench CanadianGermanGerman RussianGhanaianGreekGuamanian/ChamorroGuatemalanGuyaneseHaitianHmongHonduranHopiHoumaHungarianIcelanderIndian (Asian)IndonesianInupiatIranianIraqiIrishIroquoisIsraeliItalianJamaicanJapaneseJordanianKenyanKiowaKoreanLaotianLatvianLebaneseLiberianLithuanianLumbeeLuxembourgerMacedonianMalaysianMalteseMarshalleseMenomineeMexicanMexican American IndianMongolianMoroccanNative HawaiianNavajoNepaleseNew ZealanderNicaraguanNigerianNorthern EuropeanNorwegianOkinawanOsageOttawaPaiutePakistaniPalestinianPanamanianParaguayanPennsylvania GermanPeruvianPimaPolishPortuguesePotawatomiPuebloPuerto RicanPuget Sound SalishRomanianRussianSalvadoranSamoanScandinavianScotch-IrishScottishSeminoleSenegaleseSerbianShoshoneSierra LeoneanSiouxSlavicSlovakSloveneSomaliSouth AfricanSouth AmericanSouth American IndianSoviet UnionSpaniardSpanishSpanish AmericanSpanish American IndianSri LankanSubsaharan AfricanSudaneseSwedishSwissSyrianTaiwaneseThaiTlingit-HaidaTohono O'OdhamTonganTrinidadian and TobagonianTsimshianTurkishU.S. Virgin IslanderUgandanUkrainianUruguayanUteVenezuelanVietnameseWelshWest IndianYakamaYaquiYugoslavianYumanYup'ikZimbabwean
Immigration
NonimmigrantsImmigrantsAfghanistanAfricaAlbaniaArgentinaArmeniaAsiaAustraliaAustriaBahamasBangladeshBarbadosBelarusBelgiumBelizeBoliviaBosnia and HerzegovinaBrazilBulgariaBurma/MyanmarCabo VerdeCambodiaCameroonCanadaCaribbeanCentral AmericaChileChinaColombiaCongoCosta RicaCroatiaCubaCzechoslovakiaDenmarkDominicaDominican RepublicEastern AfricaEastern AsiaEastern EuropeEcuadorEgyptEl SalvadorEnglandEritreaEthiopiaEuropeFijiFranceGermanyGhanaGreeceGrenadaGuatemalaGuyanaHaitiHondurasHong KongHungaryIndiaIndonesiaIranIraqIrelandIsraelItalyJamaicaJapanJordanKazakhstanKenyaKoreaKuwaitLaosLatin AmericaLatviaLebanonLiberiaLithuaniaMalaysiaMexicoMicronesiaMiddle AfricaMoldovaMoroccoNepalNetherlandsNicaraguaNigeriaNorth AmericaNorth MacedoniaNorthern AfricaNorthern EuropeNorwayOceaniaPakistanPanamaPeruPhilippinesPolandPortugalRomaniaRussiaSaudi ArabiaScotlandSenegalSerbiaSierra LeoneSingaporeSomaliaSouth AfricaSouth AmericaSouth Central AsiaSouth Eastern AsiaSouthern EuropeSpainSri LankaSt. Vincent and the GrenadinesSudanSwedenSwitzerlandSyriaTaiwanThailandTrinidad and TobagoTurkeyUgandaUkraineUruguayUzbekistanVenezuelaVietnamWest IndiesWestern AfricaWestern AsiaWestern EuropeYemenZaireZimbabweAzores
Select to Compare
Race
Ancestry
AfghanAfricanAlaska NativeAlaskan AthabascanAlbanianAleutAlsatianAmericanApacheArabArapahoArgentineanArmenianAssyrian/Chaldean/SyriacAustralianAustrianBahamianBangladeshiBarbadianBasqueBelgianBelizeanBermudanBhutaneseBlackfeetBolivianBrazilianBritishBritish West IndianBulgarianBurmeseCajunCambodianCanadianCape VerdeanCarpatho RusynCelticCentral AmericanCentral American IndianCherokeeCheyenneChickasawChileanChineseChippewaChoctawColombianColvilleComancheCosta RicanCreeCreekCroatianCrowCubanCypriotCzechCzechoslovakianDanishDelawareDominicanDutchDutch West IndianEastern EuropeanEcuadorianEgyptianEnglishEstonianEthiopianEuropeanFijianFilipinoFinnishFrenchFrench American IndianFrench CanadianGermanGerman RussianGhanaianGreekGuamanian/ChamorroGuatemalanGuyaneseHaitianHmongHonduranHopiHoumaHungarianIcelanderIndian (Asian)InupiatIranianIraqiIrishIroquoisIsraeliItalianJamaicanJapaneseJordanianKenyanKiowaKoreanLaotianLatvianLebaneseLiberianLithuanianLumbeeLuxembourgerMacedonianMalaysianMalteseMarshalleseMenomineeMexicanMexican American IndianMongolianMoroccanNative HawaiianNavajoNepaleseNew ZealanderNicaraguanNigerianNorthern EuropeanNorwegianOkinawanOsageOttawaPaiutePakistaniPalestinianPanamanianParaguayanPennsylvania GermanPeruvianPimaPolishPortuguesePotawatomiPuebloPuerto RicanPuget Sound SalishRomanianRussianSalvadoranSamoanScandinavianScotch-IrishScottishSeminoleSenegaleseSerbianShoshoneSierra LeoneanSiouxSlavicSlovakSloveneSomaliSouth AfricanSouth AmericanSouth American IndianSoviet UnionSpaniardSpanishSpanish AmericanSpanish American IndianSri LankanSubsaharan AfricanSudaneseSwedishSwissSyrianTaiwaneseThaiTlingit-HaidaTohono O'OdhamTonganTrinidadian and TobagonianTsimshianTurkishU.S. Virgin IslanderUgandanUkrainianUruguayanUteVenezuelanVietnameseWelshWest IndianYakamaYaquiYugoslavianYumanYup'ikZimbabwean
Immigration
NonimmigrantsImmigrantsAfghanistanAfricaAlbaniaArgentinaArmeniaAsiaAustraliaAustriaBahamasBangladeshBarbadosBelarusBelgiumBelizeBoliviaBosnia and HerzegovinaBrazilBulgariaBurma/MyanmarCabo VerdeCambodiaCameroonCanadaCaribbeanCentral AmericaChileChinaColombiaCongoCosta RicaCroatiaCubaCzechoslovakiaDenmarkDominicaDominican RepublicEastern AfricaEastern AsiaEastern EuropeEcuadorEgyptEl SalvadorEnglandEritreaEthiopiaEuropeFijiFranceGermanyGhanaGreeceGrenadaGuatemalaGuyanaHaitiHondurasHong KongHungaryIndiaIndonesiaIranIraqIrelandIsraelItalyJamaicaJapanJordanKazakhstanKenyaKoreaKuwaitLaosLatin AmericaLatviaLebanonLiberiaLithuaniaMalaysiaMexicoMicronesiaMiddle AfricaMoldovaMoroccoNepalNetherlandsNicaraguaNigeriaNorth AmericaNorth MacedoniaNorthern AfricaNorthern EuropeNorwayOceaniaPakistanPanamaPeruPhilippinesPolandPortugalRomaniaRussiaSaudi ArabiaScotlandSenegalSerbiaSierra LeoneSingaporeSomaliaSouth AfricaSouth AmericaSouth Central AsiaSouth Eastern AsiaSouthern EuropeSpainSri LankaSt. Vincent and the GrenadinesSudanSwedenSwitzerlandSyriaTaiwanThailandTrinidad and TobagoTurkeyUgandaUkraineUruguayUzbekistanVenezuelaVietnamWest IndiesWestern AfricaWestern AsiaWestern EuropeYemenZaireZimbabweAzores
Disability Age Under 5
Income
Poverty
Unemployment
Labor Participation
Family Structure
Vehicle Availability
Education Level
Disability

Indonesian Disability Age Under 5
Exceptional

1.2%
DISABILITY | AGE UNDER 5
95.9/ 100
METRIC RATING
104th/ 347
METRIC RANK

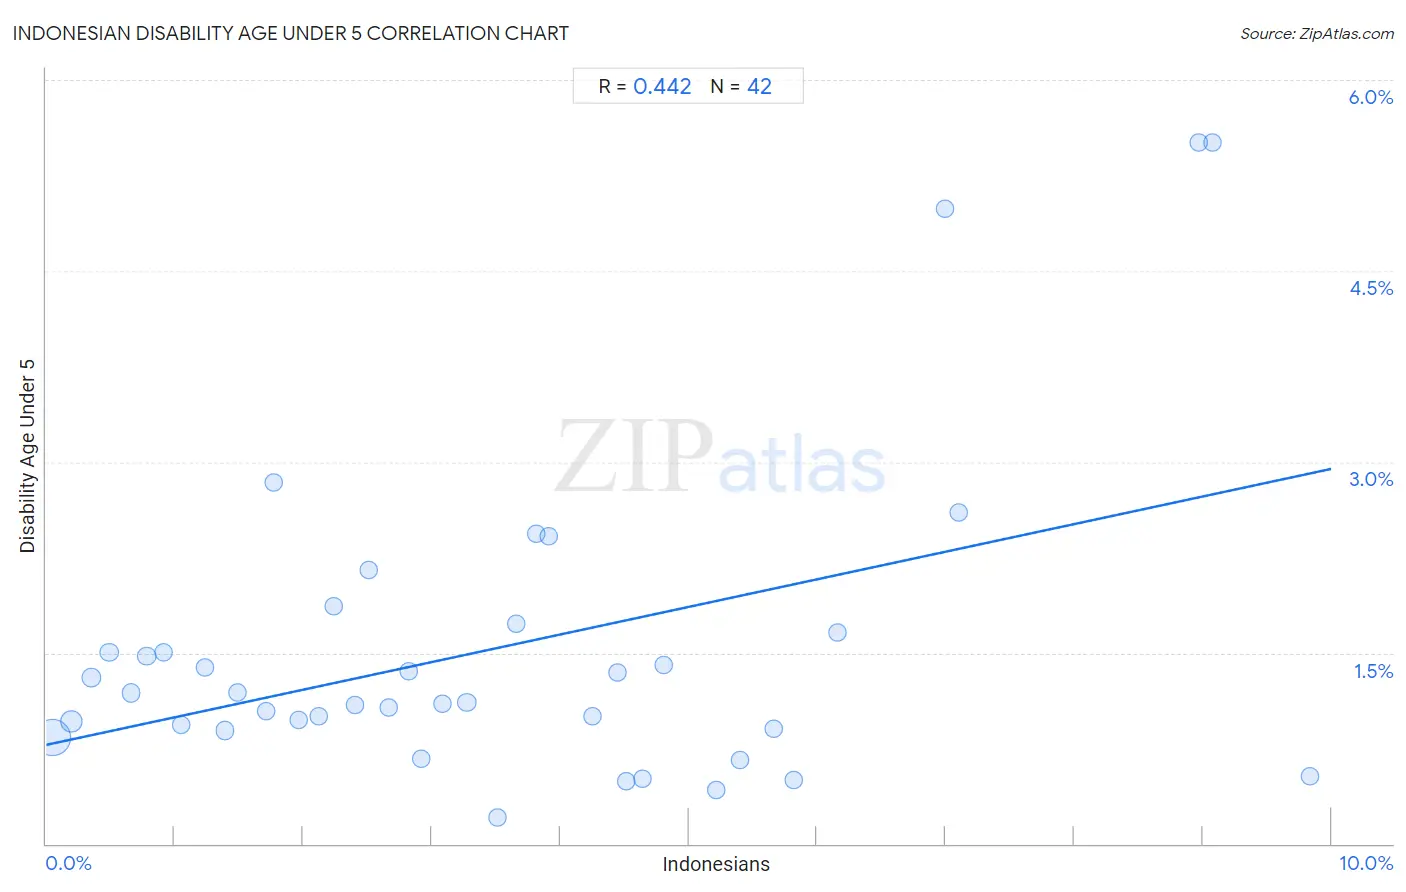
Indonesian Disability Age Under 5 Correlation Chart

The statistical analysis conducted on geographies consisting of 116,670,957 people shows a moderate positive correlation between the proportion of Indonesians and percentage of population with a disability under the age of 5 in the United States with a correlation coefficient (R) of 0.442 and weighted average of 1.2%. On average, for every 1% (one percent) increase in Indonesians within a typical geography, there is an increase of 0.22% in percentage of population with a disability under the age of 5.
Indonesian Disability Age Under 5
It is essential to understand that the correlation between the percentage of Indonesians and percentage of population with a disability under the age of 5 does not imply a direct cause-and-effect relationship. It remains uncertain whether the presence of Indonesians influences an upward or downward trend in the level of percentage of population with a disability under the age of 5 within an area, or if Indonesians simply ended up residing in those areas with higher or lower levels of percentage of population with a disability under the age of 5 due to other factors.

Demographics Similar to Indonesians by Disability Age Under 5

In terms of disability age under 5, the demographic groups most similar to Indonesians are Immigrants from Morocco (1.2%, a difference of 0.070%), Immigrants from Nicaragua (1.2%, a difference of 0.070%), Immigrants from Uganda (1.1%, a difference of 0.12%), Immigrants from South Africa (1.2%, a difference of 0.19%), and Nicaraguan (1.1%, a difference of 0.24%).
DemographicsRating | RankDisability Age Under 5
Immigrants from Iraq
96.5
/100
|
#97
Exceptional
1.1%
Immigrants from South Eastern Asia
96.5
/100
|
#98
Exceptional
1.1%
Dominicans
96.3
/100
|
#99
Exceptional
1.1%
Nicaraguans
96.3
/100
|
#100
Exceptional
1.1%
Immigrants from Uganda
96.1
/100
|
#101
Exceptional
1.1%
Immigrants from Morocco
96.0
/100
|
#102
Exceptional
1.2%
Immigrants from Nicaragua
96.0
/100
|
#103
Exceptional
1.2%
Indonesians
95.9
/100
|
#104
Exceptional
1.2%
Immigrants from South Africa
95.6
/100
|
#105
Exceptional
1.2%
Cambodians
95.4
/100
|
#106
Exceptional
1.2%
Immigrants from West Indies
95.3
/100
|
#107
Exceptional
1.2%
Iraqis
95.1
/100
|
#108
Exceptional
1.2%
Immigrants from Panama
95.0
/100
|
#109
Exceptional
1.2%
Immigrants from Lebanon
95.0
/100
|
#110
Exceptional
1.2%
Senegalese
94.6
/100
|
#111
Exceptional
1.2%

Indonesian Disability Age Under 5 Correlation Summary

MeasurementIndonesian DataDisability Age Under 5 Data
Minimum0.051%0.21%
Maximum9.8%5.5%
Range9.8%5.3%
Mean3.5%1.5%
Median3.0%1.1%
Interquartile 25% (IQ1)1.5%0.90%
Interquartile 75% (IQ3)4.8%1.7%
Interquartile Range (IQR)3.3%0.76%
Standard Deviation (Sample)2.5%1.2%
Standard Deviation (Population)2.5%1.2%

Correlation Details

Indonesian PercentileSample SizeDisability Age Under 5
[
0.0%
-
0.5%
]
0.051%
84,721,3630.84%
[
0.0%
-
0.5%
]
0.20%
15,627,7300.96%
[
0.0%
-
0.5%
]
0.35%
4,719,3431.3%
[
0.0%
-
0.5%
]
0.49%
1,478,3841.5%
[
0.5%
-
1.0%
]
0.66%
1,589,1101.2%
[
0.5%
-
1.0%
]
0.78%
1,178,5141.5%
[
0.5%
-
1.0%
]
0.91%
1,478,9831.5%
[
1.0%
-
1.5%
]
1.05%
916,2450.93%
[
1.0%
-
1.5%
]
1.23%
520,5861.4%
[
1.0%
-
1.5%
]
1.39%
756,4780.89%
[
1.0%
-
1.5%
]
1.49%
249,0231.2%
[
1.5%
-
2.0%
]
1.71%
998,5591.0%
[
1.5%
-
2.0%
]
1.77%
136,9252.8%
[
1.5%
-
2.0%
]
1.97%
357,2250.97%
[
2.0%
-
2.5%
]
2.12%
42,8921.00%
[
2.0%
-
2.5%
]
2.24%
115,0571.9%
[
2.0%
-
2.5%
]
2.40%
91,1361.1%
[
2.5%
-
3.0%
]
2.51%
63,3892.1%
[
2.5%
-
3.0%
]
2.66%
149,3141.1%
[
2.5%
-
3.0%
]
2.82%
40,2851.4%
[
2.5%
-
3.0%
]
2.92%
24,0280.66%
[
3.0%
-
3.5%
]
3.08%
92,0171.1%
[
3.0%
-
3.5%
]
3.27%
617,6001.1%
[
3.5%
-
4.0%
]
3.51%
36,7010.21%
[
3.5%
-
4.0%
]
3.66%
62,2521.7%
[
3.5%
-
4.0%
]
3.81%
10,0182.4%
[
3.5%
-
4.0%
]
3.91%
32,9952.4%
[
4.0%
-
4.5%
]
4.25%
72,3851.0%
[
4.0%
-
4.5%
]
4.45%
26,4251.3%
[
4.5%
-
5.0%
]
4.51%
20,1350.49%
[
4.5%
-
5.0%
]
4.64%
25,8720.51%
[
4.5%
-
5.0%
]
4.80%
31,7151.4%
[
5.0%
-
5.5%
]
5.22%
29,3160.42%
[
5.0%
-
5.5%
]
5.40%
31,9760.66%
[
5.5%
-
6.0%
]
5.66%
125,6970.90%
[
5.5%
-
6.0%
]
5.82%
50,0350.50%
[
6.0%
-
6.5%
]
6.15%
57,6621.7%
[
6.5%
-
7.0%
]
6.99%
25,6995.0%
[
7.0%
-
7.5%
]
7.11%
23,9802.6%
[
8.5%
-
9.0%
]
8.97%
3,0555.5%
[
9.0%
-
9.5%
]
9.08%
3,0195.5%
[
9.5%
-
10.0%
]
9.84%
37,8340.53%