Indonesian GED/Equivalency
COMPARE
Indonesian
Select to Compare
GED/Equivalency
Indonesian GED/Equivalency
82.5%
GED/EQUIVALENCY
0.1/ 100
METRIC RATING
283rd/ 347
METRIC RANK
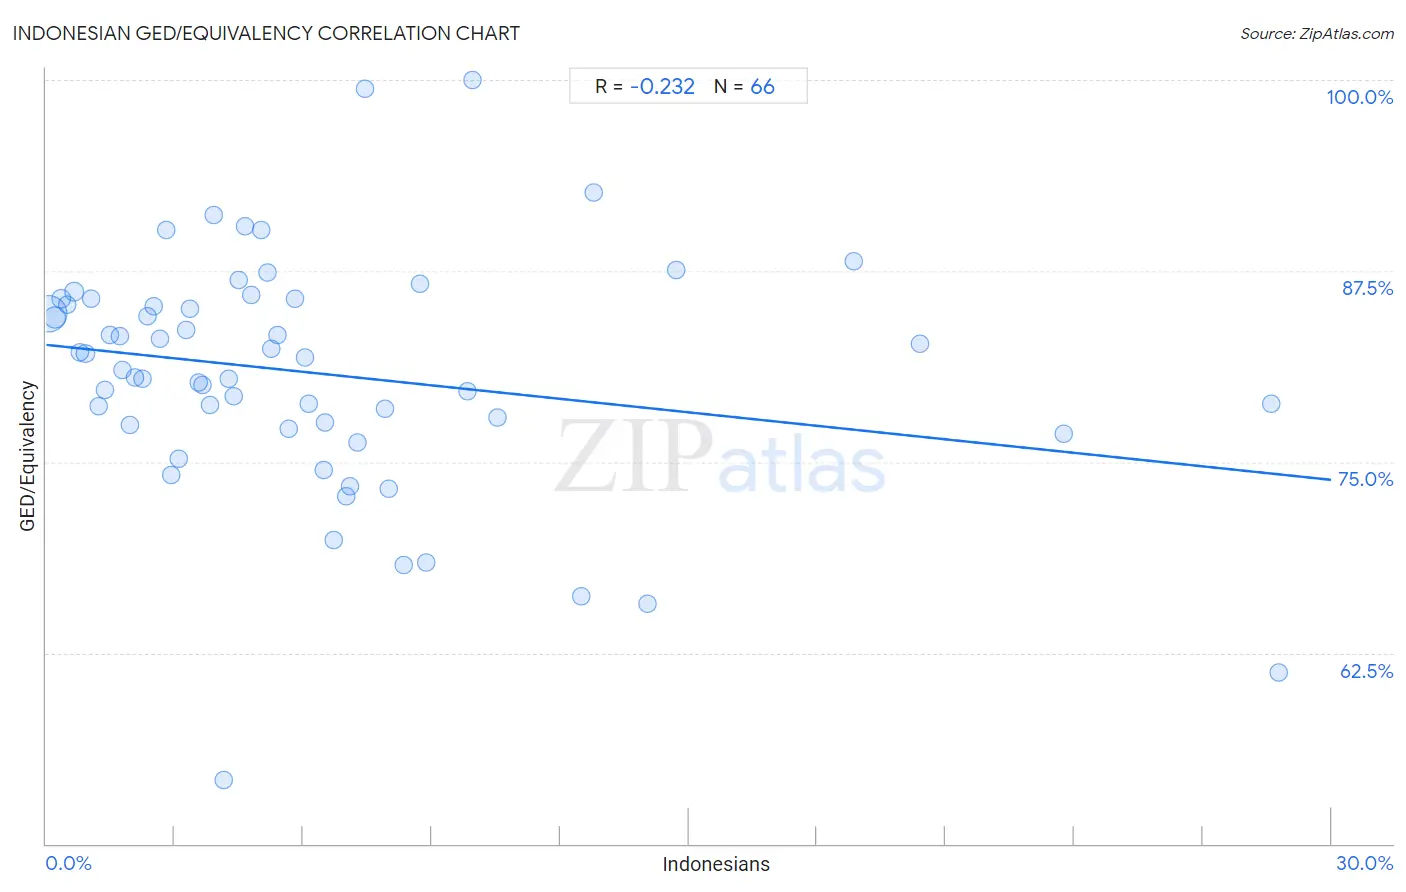
Indonesian GED/Equivalency Correlation Chart
The statistical analysis conducted on geographies consisting of 162,727,113 people shows a weak negative correlation between the proportion of Indonesians and percentage of population with at least ged/equivalency education in the United States with a correlation coefficient (R) of -0.232 and weighted average of 82.5%. On average, for every 1% (one percent) increase in Indonesians within a typical geography, there is a decrease of 0.29% in percentage of population with at least ged/equivalency education.
It is essential to understand that the correlation between the percentage of Indonesians and percentage of population with at least ged/equivalency education does not imply a direct cause-and-effect relationship. It remains uncertain whether the presence of Indonesians influences an upward or downward trend in the level of percentage of population with at least ged/equivalency education within an area, or if Indonesians simply ended up residing in those areas with higher or lower levels of percentage of population with at least ged/equivalency education due to other factors.
Demographics Similar to Indonesians by GED/Equivalency
In terms of ged/equivalency, the demographic groups most similar to Indonesians are Immigrants (82.6%, a difference of 0.050%), Immigrants from Barbados (82.4%, a difference of 0.12%), Sioux (82.6%, a difference of 0.14%), Cajun (82.4%, a difference of 0.15%), and Immigrants from West Indies (82.4%, a difference of 0.18%).
| Demographics | Rating | Rank | GED/Equivalency |
| Blacks/African Americans | 0.1 /100 | #276 | Tragic 82.8% |
| Arapaho | 0.1 /100 | #277 | Tragic 82.8% |
| Immigrants from Laos | 0.1 /100 | #278 | Tragic 82.7% |
| Immigrants from Fiji | 0.1 /100 | #279 | Tragic 82.7% |
| Cheyenne | 0.1 /100 | #280 | Tragic 82.7% |
| Sioux | 0.1 /100 | #281 | Tragic 82.6% |
| Immigrants | 0.1 /100 | #282 | Tragic 82.6% |
| Indonesians | 0.1 /100 | #283 | Tragic 82.5% |
| Immigrants from Barbados | 0.1 /100 | #284 | Tragic 82.4% |
| Cajuns | 0.0 /100 | #285 | Tragic 82.4% |
| Immigrants from West Indies | 0.0 /100 | #286 | Tragic 82.4% |
| Japanese | 0.0 /100 | #287 | Tragic 82.4% |
| Pueblo | 0.0 /100 | #288 | Tragic 82.3% |
| Immigrants from Cambodia | 0.0 /100 | #289 | Tragic 82.2% |
| Haitians | 0.0 /100 | #290 | Tragic 82.1% |
Indonesian GED/Equivalency Correlation Summary
| Measurement | Indonesian Data | GED/Equivalency Data |
| Minimum | 0.052% | 54.2% |
| Maximum | 28.8% | 100.0% |
| Range | 28.7% | 45.8% |
| Mean | 6.4% | 80.8% |
| Median | 4.7% | 81.4% |
| Interquartile 25% (IQ1) | 2.4% | 77.4% |
| Interquartile 75% (IQ3) | 7.9% | 85.7% |
| Interquartile Range (IQR) | 5.5% | 8.2% |
| Standard Deviation (Sample) | 6.2% | 7.9% |
| Standard Deviation (Population) | 6.2% | 7.9% |
Correlation Details
| Indonesian Percentile | Sample Size | GED/Equivalency |
[ 0.0% - 0.5% ] 0.052% | 112,383,208 | 84.7% |
[ 0.0% - 0.5% ] 0.20% | 23,039,189 | 84.5% |
[ 0.0% - 0.5% ] 0.35% | 7,789,055 | 85.7% |
[ 0.0% - 0.5% ] 0.49% | 3,623,087 | 85.3% |
[ 0.5% - 1.0% ] 0.65% | 2,609,842 | 86.1% |
[ 0.5% - 1.0% ] 0.79% | 2,004,488 | 82.2% |
[ 0.5% - 1.0% ] 0.92% | 2,204,775 | 82.1% |
[ 1.0% - 1.5% ] 1.06% | 1,355,224 | 85.7% |
[ 1.0% - 1.5% ] 1.23% | 619,899 | 78.6% |
[ 1.0% - 1.5% ] 1.38% | 1,126,432 | 79.7% |
[ 1.0% - 1.5% ] 1.48% | 520,197 | 83.3% |
[ 1.5% - 2.0% ] 1.71% | 1,144,191 | 83.2% |
[ 1.5% - 2.0% ] 1.79% | 342,548 | 81.0% |
[ 1.5% - 2.0% ] 1.95% | 590,482 | 77.4% |
[ 2.0% - 2.5% ] 2.09% | 252,350 | 80.5% |
[ 2.0% - 2.5% ] 2.24% | 206,163 | 80.4% |
[ 2.0% - 2.5% ] 2.37% | 177,523 | 84.6% |
[ 2.5% - 3.0% ] 2.51% | 107,823 | 85.1% |
[ 2.5% - 3.0% ] 2.66% | 338,416 | 83.1% |
[ 2.5% - 3.0% ] 2.81% | 127,703 | 90.1% |
[ 2.5% - 3.0% ] 2.91% | 28,852 | 74.1% |
[ 3.0% - 3.5% ] 3.09% | 100,868 | 75.2% |
[ 3.0% - 3.5% ] 3.27% | 639,406 | 83.6% |
[ 3.0% - 3.5% ] 3.34% | 46,923 | 85.1% |
[ 3.5% - 4.0% ] 3.55% | 84,706 | 80.2% |
[ 3.5% - 4.0% ] 3.66% | 124,609 | 80.1% |
[ 3.5% - 4.0% ] 3.82% | 75,153 | 78.7% |
[ 3.5% - 4.0% ] 3.91% | 32,995 | 91.1% |
[ 4.0% - 4.5% ] 4.14% | 41,235 | 54.2% |
[ 4.0% - 4.5% ] 4.25% | 72,643 | 80.4% |
[ 4.0% - 4.5% ] 4.38% | 87,012 | 79.3% |
[ 4.0% - 4.5% ] 4.50% | 37,068 | 86.9% |
[ 4.5% - 5.0% ] 4.64% | 25,872 | 90.4% |
[ 4.5% - 5.0% ] 4.79% | 47,355 | 85.9% |
[ 5.0% - 5.5% ] 5.01% | 2,135 | 90.2% |
[ 5.0% - 5.5% ] 5.17% | 2,321 | 87.4% |
[ 5.0% - 5.5% ] 5.25% | 52,384 | 82.4% |
[ 5.0% - 5.5% ] 5.40% | 32,443 | 83.3% |
[ 5.5% - 6.0% ] 5.66% | 125,697 | 77.1% |
[ 5.5% - 6.0% ] 5.82% | 50,035 | 85.7% |
[ 6.0% - 6.5% ] 6.03% | 879 | 81.8% |
[ 6.0% - 6.5% ] 6.14% | 79,880 | 78.8% |
[ 6.0% - 6.5% ] 6.47% | 14,553 | 74.5% |
[ 6.0% - 6.5% ] 6.50% | 15,899 | 77.5% |
[ 6.5% - 7.0% ] 6.70% | 26,684 | 69.8% |
[ 6.5% - 7.0% ] 6.99% | 25,699 | 72.8% |
[ 7.0% - 7.5% ] 7.11% | 23,980 | 73.4% |
[ 7.0% - 7.5% ] 7.28% | 19,447 | 76.3% |
[ 7.0% - 7.5% ] 7.44% | 900 | 99.4% |
[ 7.5% - 8.0% ] 7.91% | 139 | 78.5% |
[ 7.5% - 8.0% ] 8.00% | 40,641 | 73.2% |
[ 8.0% - 8.5% ] 8.35% | 24,684 | 68.3% |
[ 8.5% - 9.0% ] 8.71% | 1,377 | 86.7% |
[ 8.5% - 9.0% ] 8.87% | 2,029 | 68.4% |
[ 9.5% - 10.0% ] 9.84% | 37,834 | 79.6% |
[ 9.5% - 10.0% ] 9.95% | 382 | 100.0% |
[ 10.5% - 11.0% ] 10.54% | 56,794 | 77.9% |
[ 12.0% - 12.5% ] 12.48% | 19,701 | 66.2% |
[ 12.5% - 13.0% ] 12.78% | 266 | 92.6% |
[ 14.0% - 14.5% ] 14.02% | 19,501 | 65.7% |
[ 14.5% - 15.0% ] 14.70% | 39,082 | 87.6% |
[ 18.5% - 19.0% ] 18.85% | 191 | 88.1% |
[ 20.0% - 20.5% ] 20.39% | 1,035 | 82.8% |
[ 23.5% - 24.0% ] 23.75% | 2,088 | 76.9% |
[ 28.5% - 29.0% ] 28.59% | 738 | 78.8% |
[ 28.5% - 29.0% ] 28.78% | 403 | 61.2% |