Indonesian Wage/Income Gap
COMPARE
Indonesian
Select to Compare
Wage/Income Gap
Indonesian Wage/Income Gap
22.7%
WAGE/INCOME GAP
99.9/ 100
METRIC RATING
69th/ 347
METRIC RANK
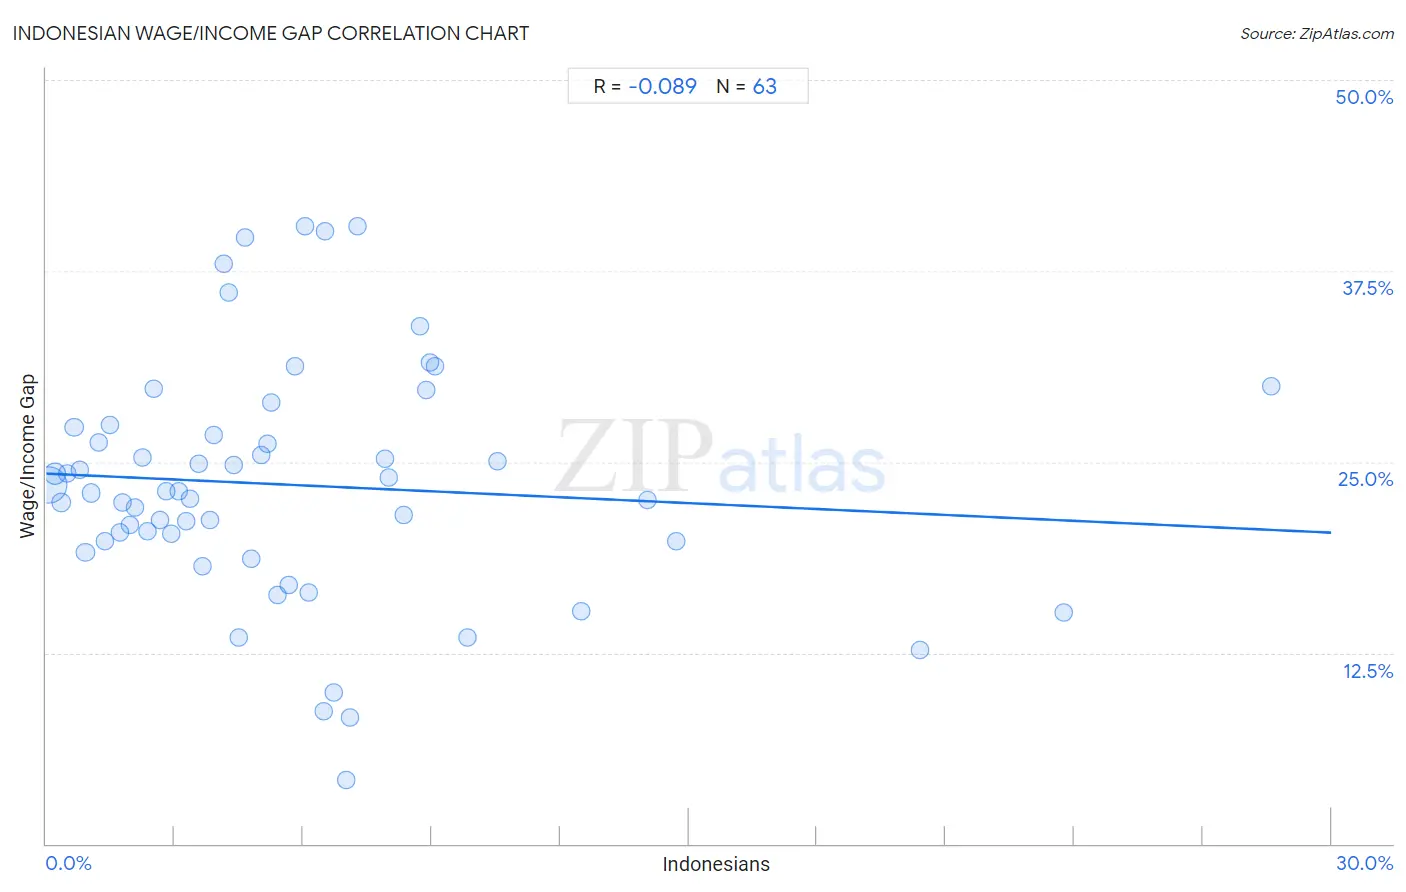
Indonesian Wage/Income Gap Correlation Chart
The statistical analysis conducted on geographies consisting of 162,719,006 people shows a slight negative correlation between the proportion of Indonesians and wage/income gap percentage in the United States with a correlation coefficient (R) of -0.089 and weighted average of 22.7%. On average, for every 1% (one percent) increase in Indonesians within a typical geography, there is a decrease of 0.13% in wage/income gap percentage.
It is essential to understand that the correlation between the percentage of Indonesians and wage/income gap percentage does not imply a direct cause-and-effect relationship. It remains uncertain whether the presence of Indonesians influences an upward or downward trend in the level of wage/income gap percentage within an area, or if Indonesians simply ended up residing in those areas with higher or lower levels of wage/income gap percentage due to other factors.
Demographics Similar to Indonesians by Wage/Income Gap
In terms of wage/income gap, the demographic groups most similar to Indonesians are Immigrants from Nigeria (22.7%, a difference of 0.030%), Menominee (22.7%, a difference of 0.040%), Immigrants from Uzbekistan (22.7%, a difference of 0.11%), Central American Indian (22.7%, a difference of 0.21%), and Immigrants from El Salvador (22.8%, a difference of 0.28%).
| Demographics | Rating | Rank | Wage/Income Gap |
| Immigrants from Guatemala | 100.0 /100 | #62 | Exceptional 22.5% |
| Immigrants from Ecuador | 100.0 /100 | #63 | Exceptional 22.5% |
| Spanish American Indians | 100.0 /100 | #64 | Exceptional 22.5% |
| Guatemalans | 99.9 /100 | #65 | Exceptional 22.6% |
| Central American Indians | 99.9 /100 | #66 | Exceptional 22.7% |
| Menominee | 99.9 /100 | #67 | Exceptional 22.7% |
| Immigrants from Nigeria | 99.9 /100 | #68 | Exceptional 22.7% |
| Indonesians | 99.9 /100 | #69 | Exceptional 22.7% |
| Immigrants from Uzbekistan | 99.9 /100 | #70 | Exceptional 22.7% |
| Immigrants from El Salvador | 99.9 /100 | #71 | Exceptional 22.8% |
| Sub-Saharan Africans | 99.9 /100 | #72 | Exceptional 22.8% |
| Immigrants from Eastern Africa | 99.9 /100 | #73 | Exceptional 22.8% |
| Immigrants from Burma/Myanmar | 99.9 /100 | #74 | Exceptional 22.8% |
| Fijians | 99.9 /100 | #75 | Exceptional 22.9% |
| Ecuadorians | 99.9 /100 | #76 | Exceptional 22.9% |
Indonesian Wage/Income Gap Correlation Summary
| Measurement | Indonesian Data | Wage/Income Gap Data |
| Minimum | 0.052% | 4.2% |
| Maximum | 28.6% | 40.4% |
| Range | 28.5% | 36.2% |
| Mean | 5.8% | 23.5% |
| Median | 4.5% | 23.1% |
| Interquartile 25% (IQ1) | 2.2% | 19.8% |
| Interquartile 75% (IQ3) | 7.3% | 27.3% |
| Interquartile Range (IQR) | 5.0% | 7.5% |
| Standard Deviation (Sample) | 5.4% | 7.8% |
| Standard Deviation (Population) | 5.3% | 7.7% |
Correlation Details
| Indonesian Percentile | Sample Size | Wage/Income Gap |
[ 0.0% - 0.5% ] 0.052% | 112,388,809 | 23.5% |
[ 0.0% - 0.5% ] 0.20% | 23,039,189 | 24.3% |
[ 0.0% - 0.5% ] 0.35% | 7,787,113 | 22.4% |
[ 0.0% - 0.5% ] 0.49% | 3,622,644 | 24.2% |
[ 0.5% - 1.0% ] 0.65% | 2,605,291 | 27.3% |
[ 0.5% - 1.0% ] 0.79% | 2,003,818 | 24.5% |
[ 0.5% - 1.0% ] 0.92% | 2,204,775 | 19.1% |
[ 1.0% - 1.5% ] 1.06% | 1,351,060 | 23.0% |
[ 1.0% - 1.5% ] 1.23% | 619,899 | 26.3% |
[ 1.0% - 1.5% ] 1.38% | 1,126,432 | 19.8% |
[ 1.0% - 1.5% ] 1.48% | 520,197 | 27.4% |
[ 1.5% - 2.0% ] 1.71% | 1,143,835 | 20.4% |
[ 1.5% - 2.0% ] 1.79% | 342,548 | 22.3% |
[ 1.5% - 2.0% ] 1.95% | 590,482 | 20.9% |
[ 2.0% - 2.5% ] 2.09% | 252,350 | 22.0% |
[ 2.0% - 2.5% ] 2.24% | 204,084 | 25.3% |
[ 2.0% - 2.5% ] 2.37% | 177,523 | 20.5% |
[ 2.5% - 3.0% ] 2.51% | 107,823 | 29.8% |
[ 2.5% - 3.0% ] 2.66% | 338,416 | 21.2% |
[ 2.5% - 3.0% ] 2.81% | 126,633 | 23.1% |
[ 2.5% - 3.0% ] 2.91% | 28,852 | 20.3% |
[ 3.0% - 3.5% ] 3.09% | 100,868 | 23.1% |
[ 3.0% - 3.5% ] 3.27% | 639,406 | 21.1% |
[ 3.0% - 3.5% ] 3.34% | 46,923 | 22.6% |
[ 3.5% - 4.0% ] 3.55% | 84,706 | 24.9% |
[ 3.5% - 4.0% ] 3.66% | 124,609 | 18.1% |
[ 3.5% - 4.0% ] 3.82% | 72,876 | 21.2% |
[ 3.5% - 4.0% ] 3.91% | 32,995 | 26.8% |
[ 4.0% - 4.5% ] 4.14% | 41,235 | 38.0% |
[ 4.0% - 4.5% ] 4.25% | 72,643 | 36.1% |
[ 4.0% - 4.5% ] 4.38% | 87,012 | 24.8% |
[ 4.0% - 4.5% ] 4.50% | 37,068 | 13.5% |
[ 4.5% - 5.0% ] 4.64% | 25,872 | 39.7% |
[ 4.5% - 5.0% ] 4.79% | 47,355 | 18.7% |
[ 5.0% - 5.5% ] 5.01% | 2,135 | 25.4% |
[ 5.0% - 5.5% ] 5.17% | 2,321 | 26.2% |
[ 5.0% - 5.5% ] 5.25% | 52,384 | 28.9% |
[ 5.0% - 5.5% ] 5.40% | 32,443 | 16.3% |
[ 5.5% - 6.0% ] 5.66% | 125,697 | 16.9% |
[ 5.5% - 6.0% ] 5.82% | 50,035 | 31.2% |
[ 6.0% - 6.5% ] 6.03% | 879 | 40.4% |
[ 6.0% - 6.5% ] 6.14% | 79,880 | 16.4% |
[ 6.0% - 6.5% ] 6.47% | 14,553 | 8.7% |
[ 6.0% - 6.5% ] 6.50% | 15,899 | 40.1% |
[ 6.5% - 7.0% ] 6.70% | 26,684 | 9.9% |
[ 6.5% - 7.0% ] 6.99% | 25,699 | 4.2% |
[ 7.0% - 7.5% ] 7.11% | 23,980 | 8.3% |
[ 7.0% - 7.5% ] 7.28% | 19,447 | 40.4% |
[ 7.5% - 8.0% ] 7.91% | 139 | 25.2% |
[ 7.5% - 8.0% ] 8.00% | 40,641 | 23.9% |
[ 8.0% - 8.5% ] 8.35% | 24,684 | 21.5% |
[ 8.5% - 9.0% ] 8.71% | 1,377 | 33.9% |
[ 8.5% - 9.0% ] 8.87% | 2,029 | 29.7% |
[ 8.5% - 9.0% ] 8.97% | 3,055 | 31.5% |
[ 9.0% - 9.5% ] 9.08% | 3,019 | 31.3% |
[ 9.5% - 10.0% ] 9.84% | 37,834 | 13.5% |
[ 10.5% - 11.0% ] 10.54% | 56,794 | 25.1% |
[ 12.0% - 12.5% ] 12.48% | 19,613 | 15.2% |
[ 14.0% - 14.5% ] 14.02% | 19,501 | 22.5% |
[ 14.5% - 15.0% ] 14.70% | 39,082 | 19.8% |
[ 20.0% - 20.5% ] 20.39% | 1,035 | 12.7% |
[ 23.5% - 24.0% ] 23.75% | 2,088 | 15.2% |
[ 28.5% - 29.0% ] 28.59% | 738 | 29.9% |