Indonesian Disability
COMPARE
Indonesian
Select to Compare
Disability
Indonesian Disability
12.2%
DISABILITY
1.4/ 100
METRIC RATING
247th/ 347
METRIC RANK
Indonesian Disability Correlation Chart
The statistical analysis conducted on geographies consisting of 162,725,313 people shows a slight negative correlation between the proportion of Indonesians and percentage of population with a disability in the United States with a correlation coefficient (R) of -0.057 and weighted average of 12.2%. On average, for every 1% (one percent) increase in Indonesians within a typical geography, there is a decrease of 0.025% in percentage of population with a disability.
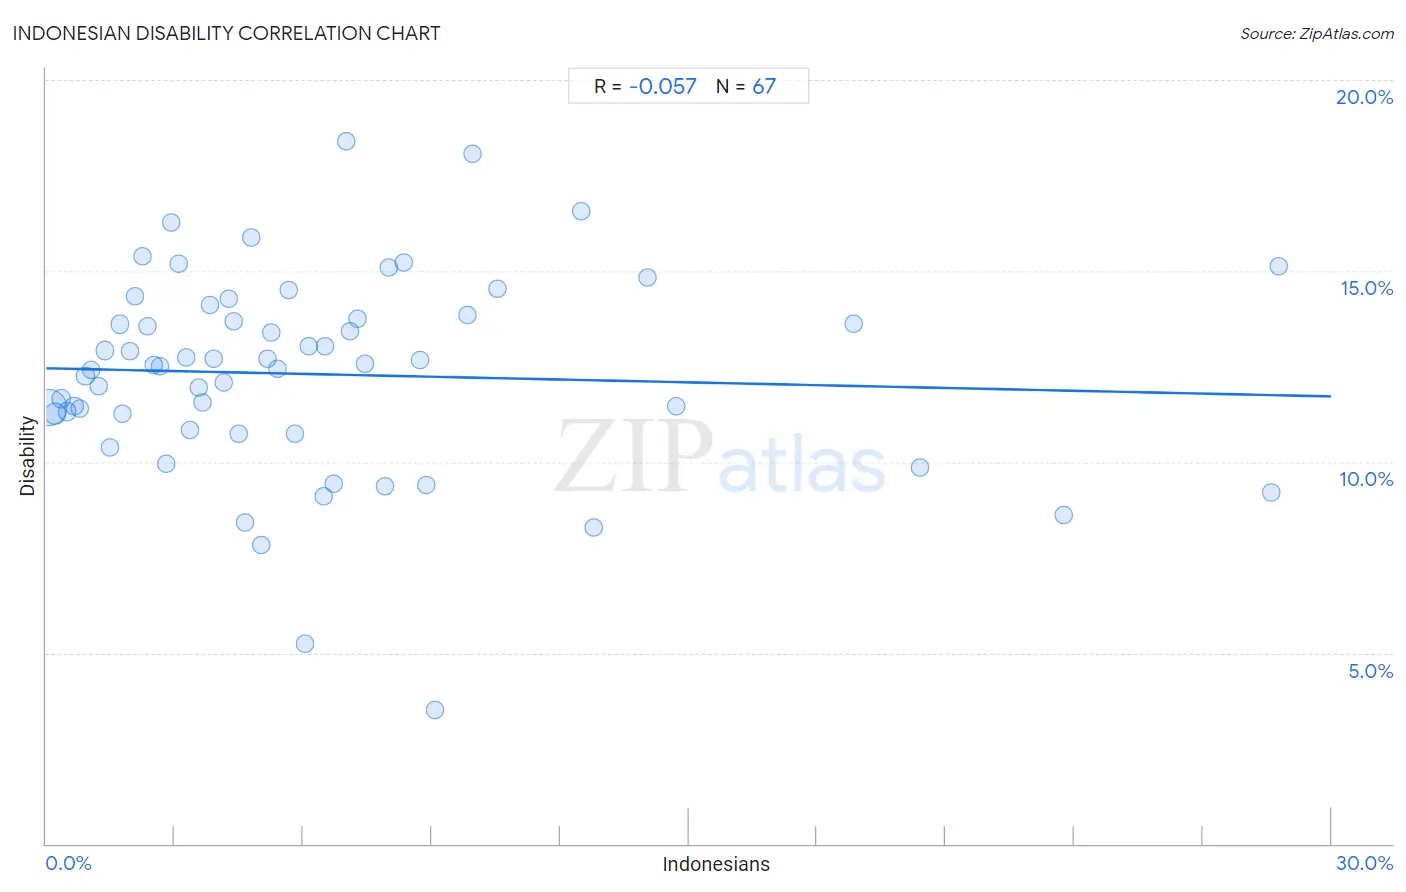
It is essential to understand that the correlation between the percentage of Indonesians and percentage of population with a disability does not imply a direct cause-and-effect relationship. It remains uncertain whether the presence of Indonesians influences an upward or downward trend in the level of percentage of population with a disability within an area, or if Indonesians simply ended up residing in those areas with higher or lower levels of percentage of population with a disability due to other factors.
Demographics Similar to Indonesians by Disability
In terms of disability, the demographic groups most similar to Indonesians are Swiss (12.2%, a difference of 0.030%), Guamanian/Chamorro (12.3%, a difference of 0.040%), Carpatho Rusyn (12.3%, a difference of 0.050%), Liberian (12.2%, a difference of 0.060%), and Subsaharan African (12.3%, a difference of 0.060%).
| Demographics | Rating | Rank | Disability |
| Hungarians | 1.7 /100 | #240 | Tragic 12.2% |
| Yugoslavians | 1.7 /100 | #241 | Tragic 12.2% |
| Poles | 1.7 /100 | #242 | Tragic 12.2% |
| British | 1.5 /100 | #243 | Tragic 12.2% |
| Basques | 1.5 /100 | #244 | Tragic 12.2% |
| Liberians | 1.5 /100 | #245 | Tragic 12.2% |
| Swiss | 1.5 /100 | #246 | Tragic 12.2% |
| Indonesians | 1.4 /100 | #247 | Tragic 12.2% |
| Guamanians/Chamorros | 1.4 /100 | #248 | Tragic 12.3% |
| Carpatho Rusyns | 1.4 /100 | #249 | Tragic 12.3% |
| Sub-Saharan Africans | 1.4 /100 | #250 | Tragic 12.3% |
| Europeans | 1.4 /100 | #251 | Tragic 12.3% |
| Bermudans | 1.1 /100 | #252 | Tragic 12.3% |
| Belgians | 0.8 /100 | #253 | Tragic 12.3% |
| German Russians | 0.8 /100 | #254 | Tragic 12.3% |
Indonesian Disability Correlation Summary
| Measurement | Indonesian Data | Disability Data |
| Minimum | 0.052% | 3.5% |
| Maximum | 28.8% | 18.4% |
| Range | 28.7% | 14.9% |
| Mean | 6.4% | 12.3% |
| Median | 4.8% | 12.5% |
| Interquartile 25% (IQ1) | 2.4% | 10.8% |
| Interquartile 75% (IQ3) | 8.0% | 13.9% |
| Interquartile Range (IQR) | 5.6% | 3.0% |
| Standard Deviation (Sample) | 6.2% | 2.7% |
| Standard Deviation (Population) | 6.1% | 2.6% |
Correlation Details
| Indonesian Percentile | Sample Size | Disability |
[ 0.0% - 0.5% ] 0.052% | 112,388,809 | 11.4% |
[ 0.0% - 0.5% ] 0.20% | 23,039,189 | 11.2% |
[ 0.0% - 0.5% ] 0.35% | 7,778,437 | 11.6% |
[ 0.0% - 0.5% ] 0.49% | 3,624,428 | 11.3% |
[ 0.5% - 1.0% ] 0.65% | 2,609,842 | 11.5% |
[ 0.5% - 1.0% ] 0.79% | 2,004,488 | 11.4% |
[ 0.5% - 1.0% ] 0.92% | 2,204,775 | 12.3% |
[ 1.0% - 1.5% ] 1.06% | 1,355,224 | 12.4% |
[ 1.0% - 1.5% ] 1.23% | 619,899 | 12.0% |
[ 1.0% - 1.5% ] 1.38% | 1,126,432 | 12.9% |
[ 1.0% - 1.5% ] 1.48% | 520,197 | 10.4% |
[ 1.5% - 2.0% ] 1.71% | 1,144,191 | 13.6% |
[ 1.5% - 2.0% ] 1.79% | 342,548 | 11.3% |
[ 1.5% - 2.0% ] 1.95% | 590,482 | 12.9% |
[ 2.0% - 2.5% ] 2.09% | 252,350 | 14.4% |
[ 2.0% - 2.5% ] 2.24% | 206,163 | 15.4% |
[ 2.0% - 2.5% ] 2.37% | 177,523 | 13.5% |
[ 2.5% - 3.0% ] 2.51% | 107,823 | 12.5% |
[ 2.5% - 3.0% ] 2.66% | 338,416 | 12.5% |
[ 2.5% - 3.0% ] 2.81% | 127,703 | 9.9% |
[ 2.5% - 3.0% ] 2.92% | 27,709 | 16.3% |
[ 3.0% - 3.5% ] 3.09% | 100,868 | 15.2% |
[ 3.0% - 3.5% ] 3.27% | 639,406 | 12.7% |
[ 3.0% - 3.5% ] 3.34% | 46,923 | 10.8% |
[ 3.5% - 4.0% ] 3.55% | 84,706 | 12.0% |
[ 3.5% - 4.0% ] 3.66% | 124,609 | 11.6% |
[ 3.5% - 4.0% ] 3.82% | 75,153 | 14.1% |
[ 3.5% - 4.0% ] 3.91% | 32,995 | 12.7% |
[ 4.0% - 4.5% ] 4.14% | 41,235 | 12.1% |
[ 4.0% - 4.5% ] 4.25% | 72,643 | 14.3% |
[ 4.0% - 4.5% ] 4.38% | 87,012 | 13.7% |
[ 4.0% - 4.5% ] 4.50% | 37,068 | 10.7% |
[ 4.5% - 5.0% ] 4.64% | 25,872 | 8.4% |
[ 4.5% - 5.0% ] 4.79% | 47,355 | 15.9% |
[ 5.0% - 5.5% ] 5.01% | 2,135 | 7.8% |
[ 5.0% - 5.5% ] 5.17% | 2,321 | 12.7% |
[ 5.0% - 5.5% ] 5.25% | 52,384 | 13.4% |
[ 5.0% - 5.5% ] 5.40% | 32,443 | 12.4% |
[ 5.5% - 6.0% ] 5.66% | 125,697 | 14.5% |
[ 5.5% - 6.0% ] 5.82% | 50,035 | 10.8% |
[ 6.0% - 6.5% ] 6.03% | 879 | 5.2% |
[ 6.0% - 6.5% ] 6.14% | 79,880 | 13.0% |
[ 6.0% - 6.5% ] 6.47% | 14,553 | 9.1% |
[ 6.0% - 6.5% ] 6.50% | 15,899 | 13.0% |
[ 6.5% - 7.0% ] 6.70% | 26,684 | 9.4% |
[ 6.5% - 7.0% ] 6.99% | 25,699 | 18.4% |
[ 7.0% - 7.5% ] 7.11% | 23,980 | 13.4% |
[ 7.0% - 7.5% ] 7.28% | 19,447 | 13.7% |
[ 7.0% - 7.5% ] 7.44% | 900 | 12.6% |
[ 7.5% - 8.0% ] 7.91% | 139 | 9.4% |
[ 7.5% - 8.0% ] 8.00% | 40,641 | 15.1% |
[ 8.0% - 8.5% ] 8.35% | 24,684 | 15.2% |
[ 8.5% - 9.0% ] 8.71% | 1,377 | 12.7% |
[ 8.5% - 9.0% ] 8.87% | 2,029 | 9.4% |
[ 9.0% - 9.5% ] 9.08% | 3,019 | 3.5% |
[ 9.5% - 10.0% ] 9.84% | 37,834 | 13.9% |
[ 9.5% - 10.0% ] 9.95% | 382 | 18.1% |
[ 10.5% - 11.0% ] 10.54% | 56,794 | 14.5% |
[ 12.0% - 12.5% ] 12.48% | 19,701 | 16.5% |
[ 12.5% - 13.0% ] 12.78% | 266 | 8.3% |
[ 14.0% - 14.5% ] 14.02% | 19,501 | 14.8% |
[ 14.5% - 15.0% ] 14.70% | 39,082 | 11.5% |
[ 18.5% - 19.0% ] 18.85% | 191 | 13.6% |
[ 20.0% - 20.5% ] 20.39% | 1,035 | 9.9% |
[ 23.5% - 24.0% ] 23.75% | 2,088 | 8.6% |
[ 28.5% - 29.0% ] 28.59% | 738 | 9.2% |
[ 28.5% - 29.0% ] 28.78% | 403 | 15.1% |