Immigrants from Sweden Self-Care Disability
COMPARE
Immigrants from Sweden
Select to Compare
Self-Care Disability
Immigrants from Sweden Self-Care Disability
2.3%
SELF-CARE DISABILITY
99.9/ 100
METRIC RATING
37th/ 347
METRIC RANK
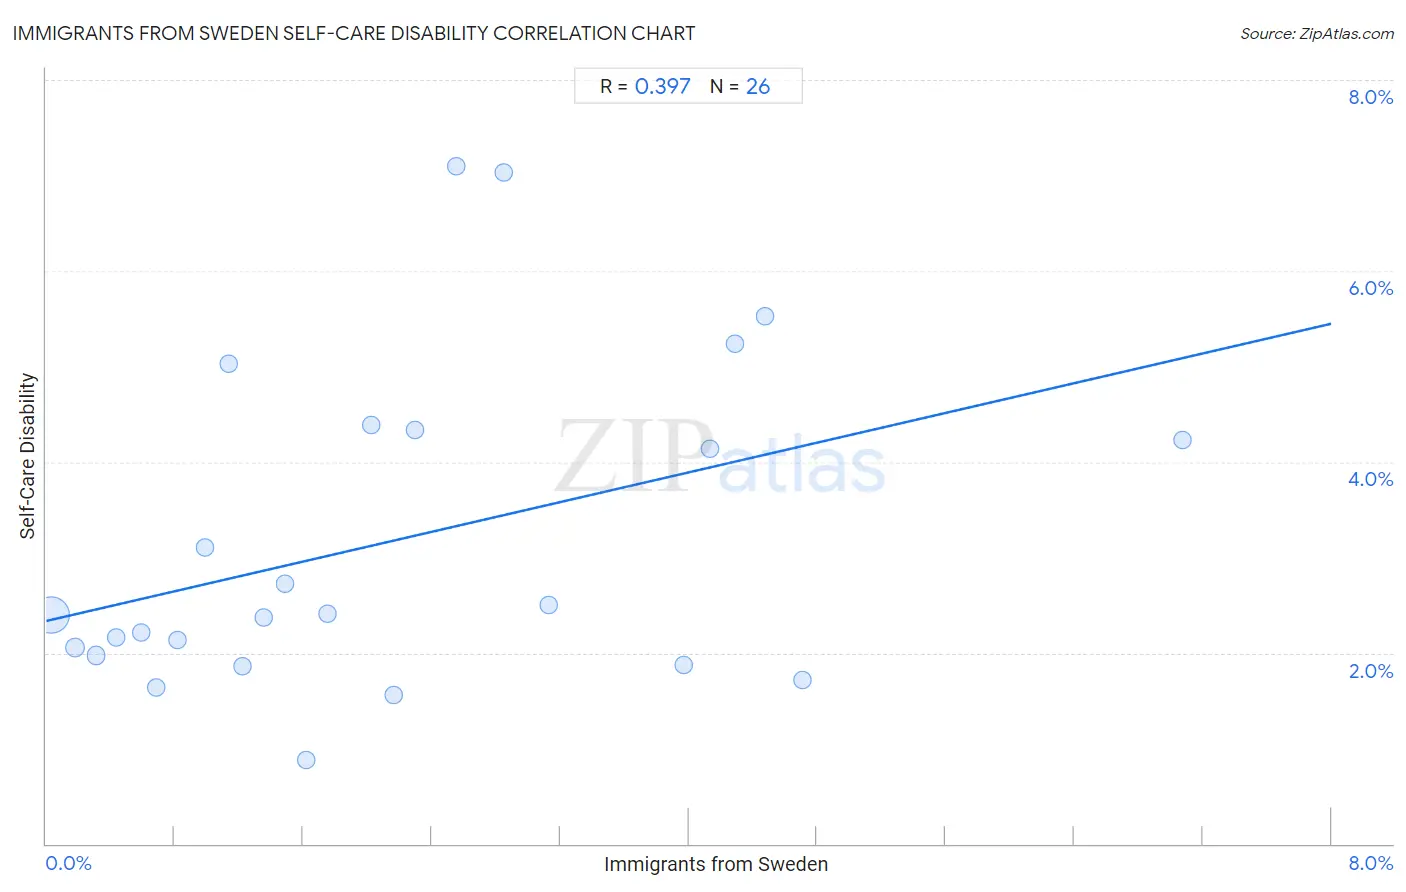
Immigrants from Sweden Self-Care Disability Correlation Chart
The statistical analysis conducted on geographies consisting of 164,653,389 people shows a mild positive correlation between the proportion of Immigrants from Sweden and percentage of population with self-care disability in the United States with a correlation coefficient (R) of 0.397 and weighted average of 2.3%. On average, for every 1% (one percent) increase in Immigrants from Sweden within a typical geography, there is an increase of 0.39% in percentage of population with self-care disability.
It is essential to understand that the correlation between the percentage of Immigrants from Sweden and percentage of population with self-care disability does not imply a direct cause-and-effect relationship. It remains uncertain whether the presence of Immigrants from Sweden influences an upward or downward trend in the level of percentage of population with self-care disability within an area, or if Immigrants from Sweden simply ended up residing in those areas with higher or lower levels of percentage of population with self-care disability due to other factors.
Demographics Similar to Immigrants from Sweden by Self-Care Disability
In terms of self-care disability, the demographic groups most similar to Immigrants from Sweden are Immigrants from Eastern Africa (2.3%, a difference of 0.13%), Immigrants from Lithuania (2.3%, a difference of 0.17%), Immigrants from Australia (2.3%, a difference of 0.18%), Immigrants from Bulgaria (2.3%, a difference of 0.23%), and Immigrants from Turkey (2.3%, a difference of 0.24%).
| Demographics | Rating | Rank | Self-Care Disability |
| Paraguayans | 99.9 /100 | #30 | Exceptional 2.3% |
| Danes | 99.9 /100 | #31 | Exceptional 2.3% |
| Burmese | 99.9 /100 | #32 | Exceptional 2.3% |
| Immigrants from Korea | 99.9 /100 | #33 | Exceptional 2.3% |
| Immigrants from Turkey | 99.9 /100 | #34 | Exceptional 2.3% |
| Immigrants from Australia | 99.9 /100 | #35 | Exceptional 2.3% |
| Immigrants from Lithuania | 99.9 /100 | #36 | Exceptional 2.3% |
| Immigrants from Sweden | 99.9 /100 | #37 | Exceptional 2.3% |
| Immigrants from Eastern Africa | 99.9 /100 | #38 | Exceptional 2.3% |
| Immigrants from Bulgaria | 99.8 /100 | #39 | Exceptional 2.3% |
| Iranians | 99.8 /100 | #40 | Exceptional 2.3% |
| Immigrants from Sudan | 99.8 /100 | #41 | Exceptional 2.3% |
| Immigrants from Uganda | 99.8 /100 | #42 | Exceptional 2.3% |
| Immigrants from Pakistan | 99.8 /100 | #43 | Exceptional 2.3% |
| Immigrants from South Africa | 99.8 /100 | #44 | Exceptional 2.3% |
Immigrants from Sweden Self-Care Disability Correlation Summary
| Measurement | Immigrants from Sweden Data | Self-Care Disability Data |
| Minimum | 0.033% | 0.87% |
| Maximum | 7.1% | 7.1% |
| Range | 7.0% | 6.2% |
| Mean | 2.2% | 3.2% |
| Median | 1.7% | 2.4% |
| Interquartile 25% (IQ1) | 0.82% | 2.0% |
| Interquartile 75% (IQ3) | 3.1% | 4.3% |
| Interquartile Range (IQR) | 2.3% | 2.4% |
| Standard Deviation (Sample) | 1.7% | 1.7% |
| Standard Deviation (Population) | 1.7% | 1.7% |
Correlation Details
| Immigrants from Sweden Percentile | Sample Size | Self-Care Disability |
[ 0.0% - 0.5% ] 0.033% | 150,977,698 | 2.4% |
[ 0.0% - 0.5% ] 0.18% | 9,517,459 | 2.1% |
[ 0.0% - 0.5% ] 0.31% | 2,619,300 | 2.0% |
[ 0.0% - 0.5% ] 0.43% | 821,617 | 2.2% |
[ 0.5% - 1.0% ] 0.59% | 254,979 | 2.2% |
[ 0.5% - 1.0% ] 0.69% | 196,298 | 1.6% |
[ 0.5% - 1.0% ] 0.82% | 74,276 | 2.1% |
[ 0.5% - 1.0% ] 0.99% | 44,027 | 3.1% |
[ 1.0% - 1.5% ] 1.13% | 37,653 | 5.0% |
[ 1.0% - 1.5% ] 1.22% | 29,646 | 1.9% |
[ 1.0% - 1.5% ] 1.35% | 29,010 | 2.4% |
[ 1.0% - 1.5% ] 1.48% | 7,081 | 2.7% |
[ 1.5% - 2.0% ] 1.62% | 13,797 | 0.87% |
[ 1.5% - 2.0% ] 1.75% | 15,169 | 2.4% |
[ 2.0% - 2.5% ] 2.03% | 5,479 | 4.4% |
[ 2.0% - 2.5% ] 2.16% | 1,667 | 1.6% |
[ 2.0% - 2.5% ] 2.30% | 348 | 4.3% |
[ 2.5% - 3.0% ] 2.55% | 274 | 7.1% |
[ 2.5% - 3.0% ] 2.85% | 667 | 7.0% |
[ 3.0% - 3.5% ] 3.12% | 640 | 2.5% |
[ 3.5% - 4.0% ] 3.97% | 3,956 | 1.9% |
[ 4.0% - 4.5% ] 4.13% | 508 | 4.1% |
[ 4.0% - 4.5% ] 4.29% | 210 | 5.2% |
[ 4.0% - 4.5% ] 4.48% | 201 | 5.5% |
[ 4.5% - 5.0% ] 4.71% | 1,231 | 1.7% |
[ 7.0% - 7.5% ] 7.07% | 198 | 4.2% |