Immigrants from Sweden GED/Equivalency

COMPARE

Immigrants from Sweden
Race
Ancestry
AfghanAfricanAlaska NativeAlaskan AthabascanAlbanianAleutAlsatianAmericanApacheArabArapahoArgentineanArmenianAssyrian/Chaldean/SyriacAustralianAustrianBahamianBangladeshiBarbadianBasqueBelgianBelizeanBermudanBhutaneseBlackfeetBolivianBrazilianBritishBritish West IndianBulgarianBurmeseCajunCambodianCanadianCape VerdeanCarpatho RusynCelticCentral AmericanCentral American IndianCherokeeCheyenneChickasawChileanChineseChippewaChoctawColombianColvilleComancheCosta RicanCreeCreekCroatianCrowCubanCypriotCzechCzechoslovakianDanishDelawareDominicanDutchDutch West IndianEastern EuropeanEcuadorianEgyptianEnglishEstonianEthiopianEuropeanFijianFilipinoFinnishFrenchFrench American IndianFrench CanadianGermanGerman RussianGhanaianGreekGuamanian/ChamorroGuatemalanGuyaneseHaitianHmongHonduranHopiHoumaHungarianIcelanderIndian (Asian)IndonesianInupiatIranianIraqiIrishIroquoisIsraeliItalianJamaicanJapaneseJordanianKenyanKiowaKoreanLaotianLatvianLebaneseLiberianLithuanianLumbeeLuxembourgerMacedonianMalaysianMalteseMarshalleseMenomineeMexicanMexican American IndianMongolianMoroccanNative HawaiianNavajoNepaleseNew ZealanderNicaraguanNigerianNorthern EuropeanNorwegianOkinawanOsageOttawaPaiutePakistaniPalestinianPanamanianParaguayanPennsylvania GermanPeruvianPimaPolishPortuguesePotawatomiPuebloPuerto RicanPuget Sound SalishRomanianRussianSalvadoranSamoanScandinavianScotch-IrishScottishSeminoleSenegaleseSerbianShoshoneSierra LeoneanSiouxSlavicSlovakSloveneSomaliSouth AfricanSouth AmericanSouth American IndianSoviet UnionSpaniardSpanishSpanish AmericanSpanish American IndianSri LankanSubsaharan AfricanSudaneseSwedishSwissSyrianTaiwaneseThaiTlingit-HaidaTohono O'OdhamTonganTrinidadian and TobagonianTsimshianTurkishU.S. Virgin IslanderUgandanUkrainianUruguayanUteVenezuelanVietnameseWelshWest IndianYakamaYaquiYugoslavianYumanYup'ikZimbabwean
Immigration
NonimmigrantsImmigrantsAfghanistanAfricaAlbaniaArgentinaArmeniaAsiaAustraliaAustriaBahamasBangladeshBarbadosBelarusBelgiumBelizeBoliviaBosnia and HerzegovinaBrazilBulgariaBurma/MyanmarCabo VerdeCambodiaCameroonCanadaCaribbeanCentral AmericaChileChinaColombiaCongoCosta RicaCroatiaCubaCzechoslovakiaDenmarkDominicaDominican RepublicEastern AfricaEastern AsiaEastern EuropeEcuadorEgyptEl SalvadorEnglandEritreaEthiopiaEuropeFijiFranceGermanyGhanaGreeceGrenadaGuatemalaGuyanaHaitiHondurasHong KongHungaryIndiaIndonesiaIranIraqIrelandIsraelItalyJamaicaJapanJordanKazakhstanKenyaKoreaKuwaitLaosLatin AmericaLatviaLebanonLiberiaLithuaniaMalaysiaMexicoMicronesiaMiddle AfricaMoldovaMoroccoNepalNetherlandsNicaraguaNigeriaNorth AmericaNorth MacedoniaNorthern AfricaNorthern EuropeNorwayOceaniaPakistanPanamaPeruPhilippinesPolandPortugalRomaniaRussiaSaudi ArabiaScotlandSenegalSerbiaSierra LeoneSingaporeSomaliaSouth AfricaSouth AmericaSouth Central AsiaSouth Eastern AsiaSouthern EuropeSpainSri LankaSt. Vincent and the GrenadinesSudanSwedenSwitzerlandSyriaTaiwanThailandTrinidad and TobagoTurkeyUgandaUkraineUruguayUzbekistanVenezuelaVietnamWest IndiesWestern AfricaWestern AsiaWestern EuropeYemenZaireZimbabweAzores
Select to Compare
Race
Ancestry
AfghanAfricanAlaska NativeAlaskan AthabascanAlbanianAleutAlsatianAmericanApacheArabArapahoArgentineanArmenianAssyrian/Chaldean/SyriacAustralianAustrianBahamianBangladeshiBarbadianBasqueBelgianBelizeanBermudanBhutaneseBlackfeetBolivianBrazilianBritishBritish West IndianBulgarianBurmeseCajunCambodianCanadianCape VerdeanCarpatho RusynCelticCentral AmericanCentral American IndianCherokeeCheyenneChickasawChileanChineseChippewaChoctawColombianColvilleComancheCosta RicanCreeCreekCroatianCrowCubanCypriotCzechCzechoslovakianDanishDelawareDominicanDutchDutch West IndianEastern EuropeanEcuadorianEgyptianEnglishEstonianEthiopianEuropeanFijianFilipinoFinnishFrenchFrench American IndianFrench CanadianGermanGerman RussianGhanaianGreekGuamanian/ChamorroGuatemalanGuyaneseHaitianHmongHonduranHopiHoumaHungarianIcelanderIndian (Asian)IndonesianInupiatIranianIraqiIrishIroquoisIsraeliItalianJamaicanJapaneseJordanianKenyanKiowaKoreanLaotianLatvianLebaneseLiberianLithuanianLumbeeLuxembourgerMacedonianMalaysianMalteseMarshalleseMenomineeMexicanMexican American IndianMongolianMoroccanNative HawaiianNavajoNepaleseNew ZealanderNicaraguanNigerianNorthern EuropeanNorwegianOkinawanOsageOttawaPaiutePakistaniPalestinianPanamanianParaguayanPennsylvania GermanPeruvianPimaPolishPortuguesePotawatomiPuebloPuerto RicanPuget Sound SalishRomanianRussianSalvadoranSamoanScandinavianScotch-IrishScottishSeminoleSenegaleseSerbianShoshoneSierra LeoneanSiouxSlavicSlovakSloveneSomaliSouth AfricanSouth AmericanSouth American IndianSoviet UnionSpaniardSpanishSpanish AmericanSpanish American IndianSri LankanSubsaharan AfricanSudaneseSwedishSwissSyrianTaiwaneseThaiTlingit-HaidaTohono O'OdhamTonganTrinidadian and TobagonianTsimshianTurkishU.S. Virgin IslanderUgandanUkrainianUruguayanUteVenezuelanVietnameseWelshWest IndianYakamaYaquiYugoslavianYumanYup'ikZimbabwean
Immigration
NonimmigrantsImmigrantsAfghanistanAfricaAlbaniaArgentinaArmeniaAsiaAustraliaAustriaBahamasBangladeshBarbadosBelarusBelgiumBelizeBoliviaBosnia and HerzegovinaBrazilBulgariaBurma/MyanmarCabo VerdeCambodiaCameroonCanadaCaribbeanCentral AmericaChileChinaColombiaCongoCosta RicaCroatiaCubaCzechoslovakiaDenmarkDominicaDominican RepublicEastern AfricaEastern AsiaEastern EuropeEcuadorEgyptEl SalvadorEnglandEritreaEthiopiaEuropeFijiFranceGermanyGhanaGreeceGrenadaGuatemalaGuyanaHaitiHondurasHong KongHungaryIndiaIndonesiaIranIraqIrelandIsraelItalyJamaicaJapanJordanKazakhstanKenyaKoreaKuwaitLaosLatin AmericaLatviaLebanonLiberiaLithuaniaMalaysiaMexicoMicronesiaMiddle AfricaMoldovaMoroccoNepalNetherlandsNicaraguaNigeriaNorth AmericaNorth MacedoniaNorthern AfricaNorthern EuropeNorwayOceaniaPakistanPanamaPeruPhilippinesPolandPortugalRomaniaRussiaSaudi ArabiaScotlandSenegalSerbiaSierra LeoneSingaporeSomaliaSouth AfricaSouth AmericaSouth Central AsiaSouth Eastern AsiaSouthern EuropeSpainSri LankaSt. Vincent and the GrenadinesSudanSwitzerlandSyriaTaiwanThailandTrinidad and TobagoTurkeyUgandaUkraineUruguayUzbekistanVenezuelaVietnamWest IndiesWestern AfricaWestern AsiaWestern EuropeYemenZaireZimbabweAzores
GED/Equivalency
Income
Poverty
Unemployment
Labor Participation
Family Structure
Vehicle Availability
Education Level
Disability

Immigrants from Sweden GED/Equivalency
Exceptional

88.4%
GED/EQUIVALENCY
99.7/ 100
METRIC RATING
33rd/ 347
METRIC RANK

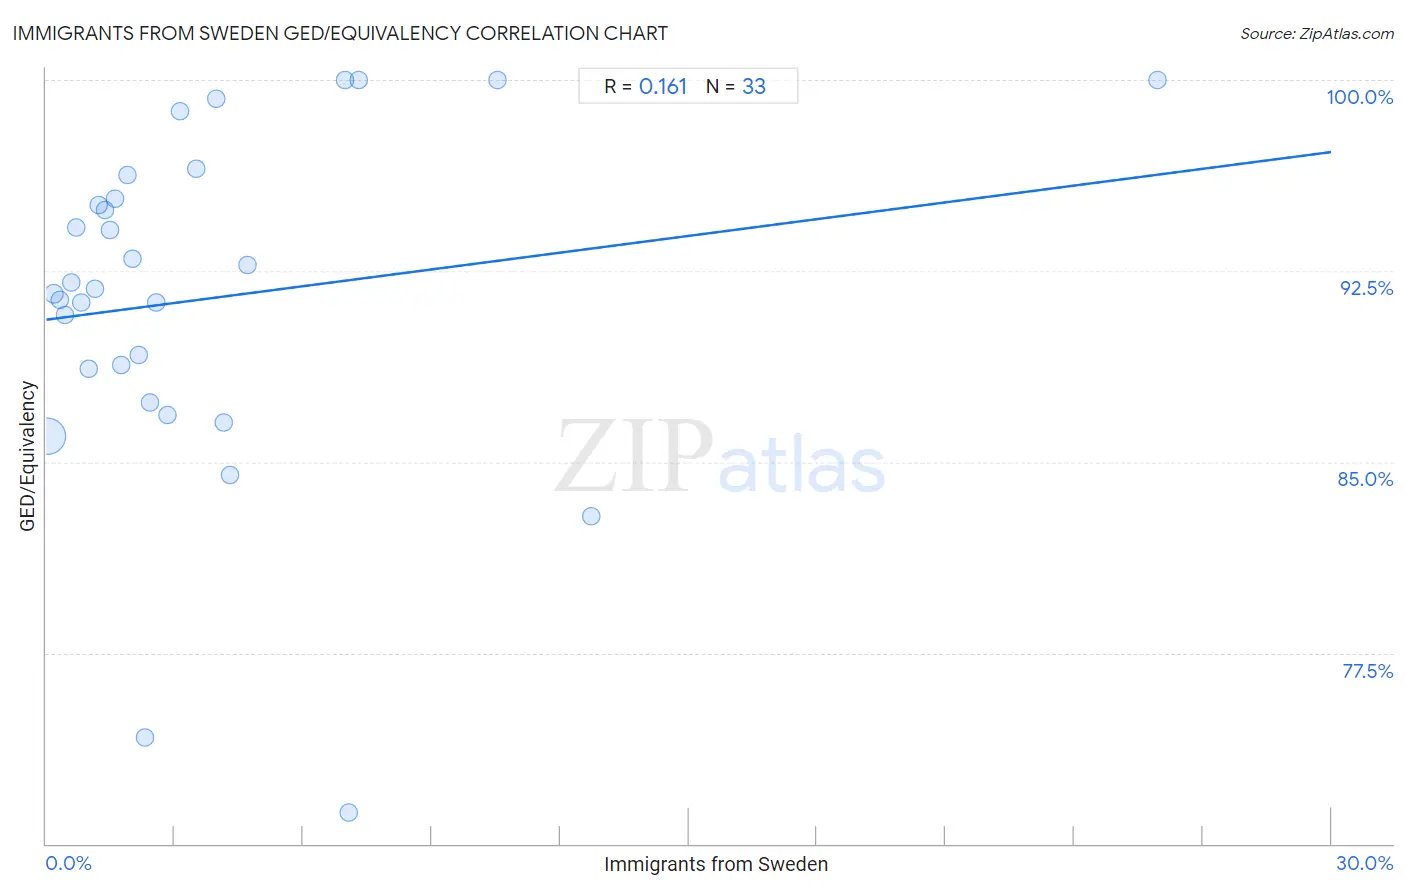
Immigrants from Sweden GED/Equivalency Correlation Chart

The statistical analysis conducted on geographies consisting of 164,737,092 people shows a poor positive correlation between the proportion of Immigrants from Sweden and percentage of population with at least ged/equivalency education in the United States with a correlation coefficient (R) of 0.161 and weighted average of 88.4%. On average, for every 1% (one percent) increase in Immigrants from Sweden within a typical geography, there is an increase of 0.22% in percentage of population with at least ged/equivalency education.
Immigrants from Sweden GED/Equivalency
It is essential to understand that the correlation between the percentage of Immigrants from Sweden and percentage of population with at least ged/equivalency education does not imply a direct cause-and-effect relationship. It remains uncertain whether the presence of Immigrants from Sweden influences an upward or downward trend in the level of percentage of population with at least ged/equivalency education within an area, or if Immigrants from Sweden simply ended up residing in those areas with higher or lower levels of percentage of population with at least ged/equivalency education due to other factors.

Demographics Similar to Immigrants from Sweden by GED/Equivalency

In terms of ged/equivalency, the demographic groups most similar to Immigrants from Sweden are Immigrants from Japan (88.4%, a difference of 0.010%), Immigrants from South Central Asia (88.4%, a difference of 0.020%), Danish (88.4%, a difference of 0.040%), Immigrants from Belgium (88.3%, a difference of 0.050%), and Bhutanese (88.4%, a difference of 0.060%).
DemographicsRating | RankGED/Equivalency
Immigrants from Australia
99.8
/100
|
#26
Exceptional
88.6%
Immigrants from Lithuania
99.8
/100
|
#27
Exceptional
88.6%
Immigrants from Northern Europe
99.8
/100
|
#28
Exceptional
88.5%
Poles
99.8
/100
|
#29
Exceptional
88.5%
Turks
99.8
/100
|
#30
Exceptional
88.5%
Bhutanese
99.8
/100
|
#31
Exceptional
88.4%
Danes
99.8
/100
|
#32
Exceptional
88.4%
Immigrants from Sweden
99.7
/100
|
#33
Exceptional
88.4%
Immigrants from Japan
99.7
/100
|
#34
Exceptional
88.4%
Immigrants from South Central Asia
99.7
/100
|
#35
Exceptional
88.4%
Immigrants from Belgium
99.7
/100
|
#36
Exceptional
88.3%
Immigrants from Austria
99.7
/100
|
#37
Exceptional
88.3%
Burmese
99.7
/100
|
#38
Exceptional
88.3%
Immigrants from Israel
99.6
/100
|
#39
Exceptional
88.2%
Italians
99.6
/100
|
#40
Exceptional
88.2%

Immigrants from Sweden GED/Equivalency Correlation Summary

MeasurementImmigrants from Sweden DataGED/Equivalency Data
Minimum0.033%71.2%
Maximum25.9%100.0%
Range25.9%28.8%
Mean3.7%91.4%
Median2.2%91.8%
Interquartile 25% (IQ1)1.1%88.0%
Interquartile 75% (IQ3)4.2%95.8%
Interquartile Range (IQR)3.1%7.8%
Standard Deviation (Sample)5.0%6.8%
Standard Deviation (Population)4.9%6.6%

Correlation Details

Immigrants from Sweden PercentileSample SizeGED/Equivalency
[
0.0%
-
0.5%
]
0.033%
151,005,39986.0%
[
0.0%
-
0.5%
]
0.18%
9,529,45291.6%
[
0.0%
-
0.5%
]
0.31%
2,619,30091.3%
[
0.0%
-
0.5%
]
0.43%
824,97990.8%
[
0.5%
-
1.0%
]
0.59%
258,22592.1%
[
0.5%
-
1.0%
]
0.69%
206,50294.2%
[
0.5%
-
1.0%
]
0.82%
76,07491.2%
[
0.5%
-
1.0%
]
0.99%
49,76888.7%
[
1.0%
-
1.5%
]
1.13%
38,17291.8%
[
1.0%
-
1.5%
]
1.22%
32,66095.1%
[
1.0%
-
1.5%
]
1.36%
35,50894.9%
[
1.0%
-
1.5%
]
1.50%
10,68294.1%
[
1.5%
-
2.0%
]
1.62%
15,08495.4%
[
1.5%
-
2.0%
]
1.75%
15,16988.8%
[
1.5%
-
2.0%
]
1.91%
73396.3%
[
2.0%
-
2.5%
]
2.03%
5,47993.0%
[
2.0%
-
2.5%
]
2.16%
1,66789.2%
[
2.0%
-
2.5%
]
2.30%
34874.2%
[
2.0%
-
2.5%
]
2.43%
65887.3%
[
2.5%
-
3.0%
]
2.55%
27491.3%
[
2.5%
-
3.0%
]
2.83%
98986.8%
[
3.0%
-
3.5%
]
3.13%
2,04698.8%
[
3.0%
-
3.5%
]
3.49%
71696.5%
[
3.5%
-
4.0%
]
3.97%
3,95699.3%
[
4.0%
-
4.5%
]
4.13%
50886.5%
[
4.0%
-
4.5%
]
4.29%
21084.5%
[
4.5%
-
5.0%
]
4.71%
1,23192.7%
[
6.5%
-
7.0%
]
6.99%
229100.0%
[
7.0%
-
7.5%
]
7.07%
19871.2%
[
7.0%
-
7.5%
]
7.30%
178100.0%
[
10.5%
-
11.0%
]
10.53%
57100.0%
[
12.5%
-
13.0%
]
12.72%
45682.9%
[
25.5%
-
26.0%
]
25.95%
185100.0%