Immigrants from Sweden Wage/Income Gap

COMPARE

Immigrants from Sweden
Race
Ancestry
AfghanAfricanAlaska NativeAlaskan AthabascanAlbanianAleutAlsatianAmericanApacheArabArapahoArgentineanArmenianAssyrian/Chaldean/SyriacAustralianAustrianBahamianBangladeshiBarbadianBasqueBelgianBelizeanBermudanBhutaneseBlackfeetBolivianBrazilianBritishBritish West IndianBulgarianBurmeseCajunCambodianCanadianCape VerdeanCarpatho RusynCelticCentral AmericanCentral American IndianCherokeeCheyenneChickasawChileanChineseChippewaChoctawColombianColvilleComancheCosta RicanCreeCreekCroatianCrowCubanCypriotCzechCzechoslovakianDanishDelawareDominicanDutchDutch West IndianEastern EuropeanEcuadorianEgyptianEnglishEstonianEthiopianEuropeanFijianFilipinoFinnishFrenchFrench American IndianFrench CanadianGermanGerman RussianGhanaianGreekGuamanian/ChamorroGuatemalanGuyaneseHaitianHmongHonduranHopiHoumaHungarianIcelanderIndian (Asian)IndonesianInupiatIranianIraqiIrishIroquoisIsraeliItalianJamaicanJapaneseJordanianKenyanKiowaKoreanLaotianLatvianLebaneseLiberianLithuanianLumbeeLuxembourgerMacedonianMalaysianMalteseMarshalleseMenomineeMexicanMexican American IndianMongolianMoroccanNative HawaiianNavajoNepaleseNew ZealanderNicaraguanNigerianNorthern EuropeanNorwegianOkinawanOsageOttawaPaiutePakistaniPalestinianPanamanianParaguayanPennsylvania GermanPeruvianPimaPolishPortuguesePotawatomiPuebloPuerto RicanPuget Sound SalishRomanianRussianSalvadoranSamoanScandinavianScotch-IrishScottishSeminoleSenegaleseSerbianShoshoneSierra LeoneanSiouxSlavicSlovakSloveneSomaliSouth AfricanSouth AmericanSouth American IndianSoviet UnionSpaniardSpanishSpanish AmericanSpanish American IndianSri LankanSubsaharan AfricanSudaneseSwedishSwissSyrianTaiwaneseThaiTlingit-HaidaTohono O'OdhamTonganTrinidadian and TobagonianTsimshianTurkishU.S. Virgin IslanderUgandanUkrainianUruguayanUteVenezuelanVietnameseWelshWest IndianYakamaYaquiYugoslavianYumanYup'ikZimbabwean
Immigration
NonimmigrantsImmigrantsAfghanistanAfricaAlbaniaArgentinaArmeniaAsiaAustraliaAustriaBahamasBangladeshBarbadosBelarusBelgiumBelizeBoliviaBosnia and HerzegovinaBrazilBulgariaBurma/MyanmarCabo VerdeCambodiaCameroonCanadaCaribbeanCentral AmericaChileChinaColombiaCongoCosta RicaCroatiaCubaCzechoslovakiaDenmarkDominicaDominican RepublicEastern AfricaEastern AsiaEastern EuropeEcuadorEgyptEl SalvadorEnglandEritreaEthiopiaEuropeFijiFranceGermanyGhanaGreeceGrenadaGuatemalaGuyanaHaitiHondurasHong KongHungaryIndiaIndonesiaIranIraqIrelandIsraelItalyJamaicaJapanJordanKazakhstanKenyaKoreaKuwaitLaosLatin AmericaLatviaLebanonLiberiaLithuaniaMalaysiaMexicoMicronesiaMiddle AfricaMoldovaMoroccoNepalNetherlandsNicaraguaNigeriaNorth AmericaNorth MacedoniaNorthern AfricaNorthern EuropeNorwayOceaniaPakistanPanamaPeruPhilippinesPolandPortugalRomaniaRussiaSaudi ArabiaScotlandSenegalSerbiaSierra LeoneSingaporeSomaliaSouth AfricaSouth AmericaSouth Central AsiaSouth Eastern AsiaSouthern EuropeSpainSri LankaSt. Vincent and the GrenadinesSudanSwedenSwitzerlandSyriaTaiwanThailandTrinidad and TobagoTurkeyUgandaUkraineUruguayUzbekistanVenezuelaVietnamWest IndiesWestern AfricaWestern AsiaWestern EuropeYemenZaireZimbabweAzores
Select to Compare
Race
Ancestry
AfghanAfricanAlaska NativeAlaskan AthabascanAlbanianAleutAlsatianAmericanApacheArabArapahoArgentineanArmenianAssyrian/Chaldean/SyriacAustralianAustrianBahamianBangladeshiBarbadianBasqueBelgianBelizeanBermudanBhutaneseBlackfeetBolivianBrazilianBritishBritish West IndianBulgarianBurmeseCajunCambodianCanadianCape VerdeanCarpatho RusynCelticCentral AmericanCentral American IndianCherokeeCheyenneChickasawChileanChineseChippewaChoctawColombianColvilleComancheCosta RicanCreeCreekCroatianCrowCubanCypriotCzechCzechoslovakianDanishDelawareDominicanDutchDutch West IndianEastern EuropeanEcuadorianEgyptianEnglishEstonianEthiopianEuropeanFijianFilipinoFinnishFrenchFrench American IndianFrench CanadianGermanGerman RussianGhanaianGreekGuamanian/ChamorroGuatemalanGuyaneseHaitianHmongHonduranHopiHoumaHungarianIcelanderIndian (Asian)IndonesianInupiatIranianIraqiIrishIroquoisIsraeliItalianJamaicanJapaneseJordanianKenyanKiowaKoreanLaotianLatvianLebaneseLiberianLithuanianLumbeeLuxembourgerMacedonianMalaysianMalteseMarshalleseMenomineeMexicanMexican American IndianMongolianMoroccanNative HawaiianNavajoNepaleseNew ZealanderNicaraguanNigerianNorthern EuropeanNorwegianOkinawanOsageOttawaPaiutePakistaniPalestinianPanamanianParaguayanPennsylvania GermanPeruvianPimaPolishPortuguesePotawatomiPuebloPuerto RicanPuget Sound SalishRomanianRussianSalvadoranSamoanScandinavianScotch-IrishScottishSeminoleSenegaleseSerbianShoshoneSierra LeoneanSiouxSlavicSlovakSloveneSomaliSouth AfricanSouth AmericanSouth American IndianSoviet UnionSpaniardSpanishSpanish AmericanSpanish American IndianSri LankanSubsaharan AfricanSudaneseSwedishSwissSyrianTaiwaneseThaiTlingit-HaidaTohono O'OdhamTonganTrinidadian and TobagonianTsimshianTurkishU.S. Virgin IslanderUgandanUkrainianUruguayanUteVenezuelanVietnameseWelshWest IndianYakamaYaquiYugoslavianYumanYup'ikZimbabwean
Immigration
NonimmigrantsImmigrantsAfghanistanAfricaAlbaniaArgentinaArmeniaAsiaAustraliaAustriaBahamasBangladeshBarbadosBelarusBelgiumBelizeBoliviaBosnia and HerzegovinaBrazilBulgariaBurma/MyanmarCabo VerdeCambodiaCameroonCanadaCaribbeanCentral AmericaChileChinaColombiaCongoCosta RicaCroatiaCubaCzechoslovakiaDenmarkDominicaDominican RepublicEastern AfricaEastern AsiaEastern EuropeEcuadorEgyptEl SalvadorEnglandEritreaEthiopiaEuropeFijiFranceGermanyGhanaGreeceGrenadaGuatemalaGuyanaHaitiHondurasHong KongHungaryIndiaIndonesiaIranIraqIrelandIsraelItalyJamaicaJapanJordanKazakhstanKenyaKoreaKuwaitLaosLatin AmericaLatviaLebanonLiberiaLithuaniaMalaysiaMexicoMicronesiaMiddle AfricaMoldovaMoroccoNepalNetherlandsNicaraguaNigeriaNorth AmericaNorth MacedoniaNorthern AfricaNorthern EuropeNorwayOceaniaPakistanPanamaPeruPhilippinesPolandPortugalRomaniaRussiaSaudi ArabiaScotlandSenegalSerbiaSierra LeoneSingaporeSomaliaSouth AfricaSouth AmericaSouth Central AsiaSouth Eastern AsiaSouthern EuropeSpainSri LankaSt. Vincent and the GrenadinesSudanSwitzerlandSyriaTaiwanThailandTrinidad and TobagoTurkeyUgandaUkraineUruguayUzbekistanVenezuelaVietnamWest IndiesWestern AfricaWestern AsiaWestern EuropeYemenZaireZimbabweAzores
Wage/Income Gap
Income
Poverty
Unemployment
Labor Participation
Family Structure
Vehicle Availability
Education Level
Disability

Immigrants from Sweden Wage/Income Gap
Tragic

28.1%
WAGE/INCOME GAP
0.4/ 100
METRIC RATING
284th/ 347
METRIC RANK

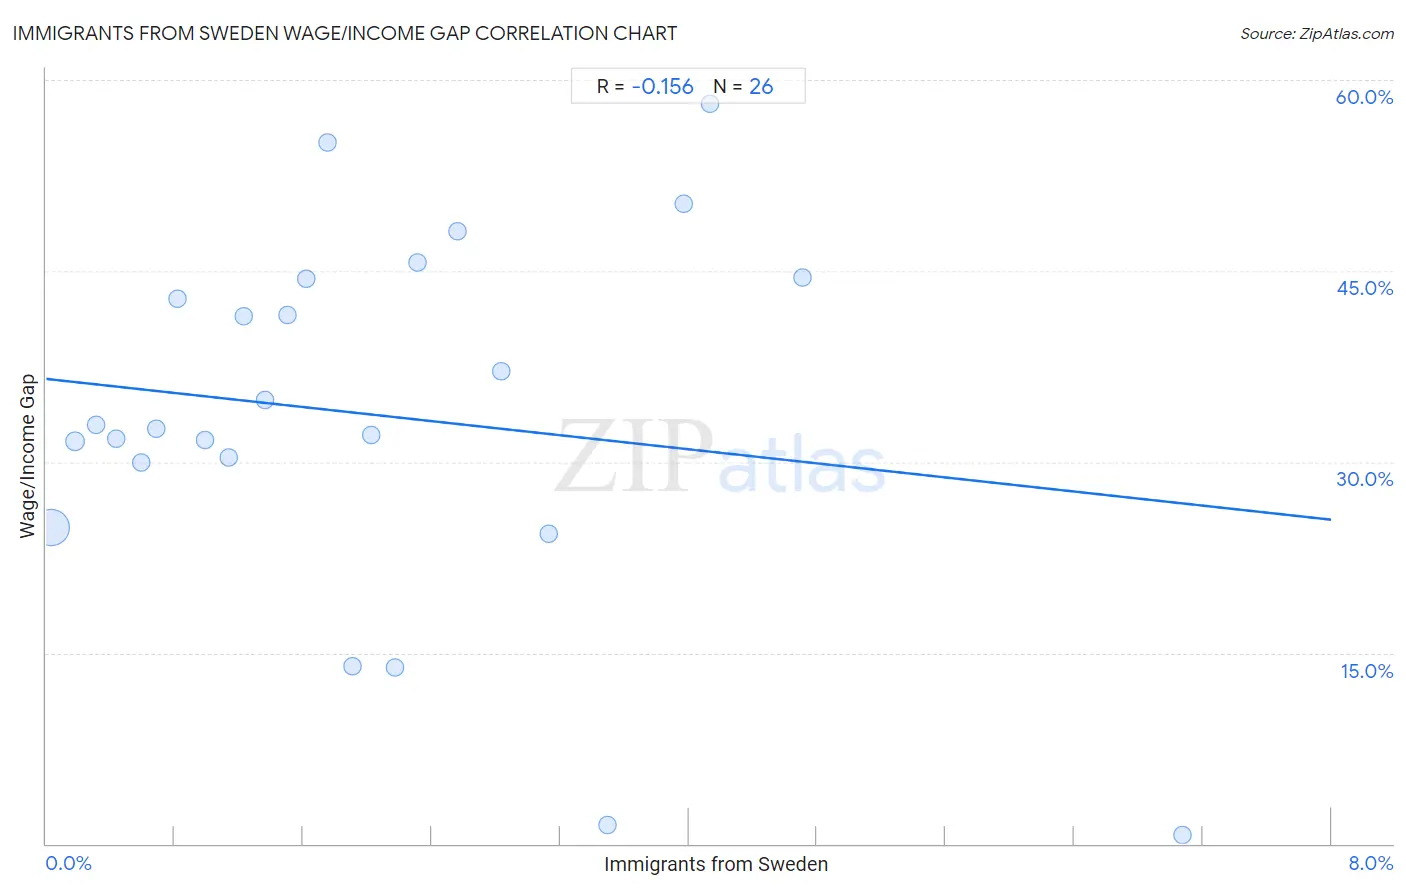
Immigrants from Sweden Wage/Income Gap Correlation Chart

The statistical analysis conducted on geographies consisting of 164,690,992 people shows a poor negative correlation between the proportion of Immigrants from Sweden and wage/income gap percentage in the United States with a correlation coefficient (R) of -0.156 and weighted average of 28.1%. On average, for every 1% (one percent) increase in Immigrants from Sweden within a typical geography, there is a decrease of 1.4% in wage/income gap percentage.
Immigrants from Sweden Wage/Income Gap
It is essential to understand that the correlation between the percentage of Immigrants from Sweden and wage/income gap percentage does not imply a direct cause-and-effect relationship. It remains uncertain whether the presence of Immigrants from Sweden influences an upward or downward trend in the level of wage/income gap percentage within an area, or if Immigrants from Sweden simply ended up residing in those areas with higher or lower levels of wage/income gap percentage due to other factors.

Demographics Similar to Immigrants from Sweden by Wage/Income Gap

In terms of wage/income gap, the demographic groups most similar to Immigrants from Sweden are French Canadian (28.1%, a difference of 0.010%), Italian (28.1%, a difference of 0.13%), Immigrants from Austria (28.1%, a difference of 0.16%), South African (28.0%, a difference of 0.18%), and Okinawan (28.1%, a difference of 0.19%).
DemographicsRating | RankWage/Income Gap
Latvians
0.7
/100
|
#277
Tragic
27.9%
Immigrants from England
0.6
/100
|
#278
Tragic
27.9%
Romanians
0.5
/100
|
#279
Tragic
28.0%
Russians
0.5
/100
|
#280
Tragic
28.0%
Burmese
0.5
/100
|
#281
Tragic
28.0%
South Africans
0.5
/100
|
#282
Tragic
28.0%
French Canadians
0.4
/100
|
#283
Tragic
28.1%
Immigrants from Sweden
0.4
/100
|
#284
Tragic
28.1%
Italians
0.4
/100
|
#285
Tragic
28.1%
Immigrants from Austria
0.4
/100
|
#286
Tragic
28.1%
Okinawans
0.4
/100
|
#287
Tragic
28.1%
Choctaw
0.4
/100
|
#288
Tragic
28.1%
Canadians
0.3
/100
|
#289
Tragic
28.1%
Australians
0.3
/100
|
#290
Tragic
28.2%
Czechoslovakians
0.3
/100
|
#291
Tragic
28.2%

Immigrants from Sweden Wage/Income Gap Correlation Summary

MeasurementImmigrants from Sweden DataWage/Income Gap Data
Minimum0.033%0.69%
Maximum7.1%58.2%
Range7.0%57.5%
Mean2.0%33.7%
Median1.7%32.8%
Interquartile 25% (IQ1)0.82%30.0%
Interquartile 75% (IQ3)2.8%44.4%
Interquartile Range (IQR)2.0%14.4%
Standard Deviation (Sample)1.6%14.5%
Standard Deviation (Population)1.6%14.2%

Correlation Details

Immigrants from Sweden PercentileSample SizeWage/Income Gap
[
0.0%
-
0.5%
]
0.033%
151,001,24524.8%
[
0.0%
-
0.5%
]
0.18%
9,528,79031.6%
[
0.0%
-
0.5%
]
0.31%
2,611,41232.9%
[
0.0%
-
0.5%
]
0.43%
813,00731.8%
[
0.5%
-
1.0%
]
0.59%
257,45930.0%
[
0.5%
-
1.0%
]
0.69%
202,10532.6%
[
0.5%
-
1.0%
]
0.82%
75,23742.8%
[
0.5%
-
1.0%
]
0.99%
48,30131.8%
[
1.0%
-
1.5%
]
1.14%
35,25730.3%
[
1.0%
-
1.5%
]
1.23%
27,61641.4%
[
1.0%
-
1.5%
]
1.36%
34,15634.8%
[
1.0%
-
1.5%
]
1.50%
10,14441.6%
[
1.5%
-
2.0%
]
1.62%
14,66644.4%
[
1.5%
-
2.0%
]
1.75%
15,16955.1%
[
1.5%
-
2.0%
]
1.91%
73314.0%
[
2.0%
-
2.5%
]
2.03%
5,23132.1%
[
2.0%
-
2.5%
]
2.17%
1,24413.8%
[
2.0%
-
2.5%
]
2.31%
17345.7%
[
2.5%
-
3.0%
]
2.56%
23448.1%
[
2.5%
-
3.0%
]
2.83%
98937.1%
[
3.0%
-
3.5%
]
3.13%
1,21524.3%
[
3.0%
-
3.5%
]
3.49%
7161.5%
[
3.5%
-
4.0%
]
3.97%
3,95650.2%
[
4.0%
-
4.5%
]
4.13%
50858.2%
[
4.5%
-
5.0%
]
4.71%
1,23144.5%
[
7.0%
-
7.5%
]
7.07%
1980.69%