Immigrants from Sweden Disability

COMPARE

Immigrants from Sweden
Race
Ancestry
AfghanAfricanAlaska NativeAlaskan AthabascanAlbanianAleutAlsatianAmericanApacheArabArapahoArgentineanArmenianAssyrian/Chaldean/SyriacAustralianAustrianBahamianBangladeshiBarbadianBasqueBelgianBelizeanBermudanBhutaneseBlackfeetBolivianBrazilianBritishBritish West IndianBulgarianBurmeseCajunCambodianCanadianCape VerdeanCarpatho RusynCelticCentral AmericanCentral American IndianCherokeeCheyenneChickasawChileanChineseChippewaChoctawColombianColvilleComancheCosta RicanCreeCreekCroatianCrowCubanCypriotCzechCzechoslovakianDanishDelawareDominicanDutchDutch West IndianEastern EuropeanEcuadorianEgyptianEnglishEstonianEthiopianEuropeanFijianFilipinoFinnishFrenchFrench American IndianFrench CanadianGermanGerman RussianGhanaianGreekGuamanian/ChamorroGuatemalanGuyaneseHaitianHmongHonduranHopiHoumaHungarianIcelanderIndian (Asian)IndonesianInupiatIranianIraqiIrishIroquoisIsraeliItalianJamaicanJapaneseJordanianKenyanKiowaKoreanLaotianLatvianLebaneseLiberianLithuanianLumbeeLuxembourgerMacedonianMalaysianMalteseMarshalleseMenomineeMexicanMexican American IndianMongolianMoroccanNative HawaiianNavajoNepaleseNew ZealanderNicaraguanNigerianNorthern EuropeanNorwegianOkinawanOsageOttawaPaiutePakistaniPalestinianPanamanianParaguayanPennsylvania GermanPeruvianPimaPolishPortuguesePotawatomiPuebloPuerto RicanPuget Sound SalishRomanianRussianSalvadoranSamoanScandinavianScotch-IrishScottishSeminoleSenegaleseSerbianShoshoneSierra LeoneanSiouxSlavicSlovakSloveneSomaliSouth AfricanSouth AmericanSouth American IndianSoviet UnionSpaniardSpanishSpanish AmericanSpanish American IndianSri LankanSubsaharan AfricanSudaneseSwedishSwissSyrianTaiwaneseThaiTlingit-HaidaTohono O'OdhamTonganTrinidadian and TobagonianTsimshianTurkishU.S. Virgin IslanderUgandanUkrainianUruguayanUteVenezuelanVietnameseWelshWest IndianYakamaYaquiYugoslavianYumanYup'ikZimbabwean
Immigration
NonimmigrantsImmigrantsAfghanistanAfricaAlbaniaArgentinaArmeniaAsiaAustraliaAustriaBahamasBangladeshBarbadosBelarusBelgiumBelizeBoliviaBosnia and HerzegovinaBrazilBulgariaBurma/MyanmarCabo VerdeCambodiaCameroonCanadaCaribbeanCentral AmericaChileChinaColombiaCongoCosta RicaCroatiaCubaCzechoslovakiaDenmarkDominicaDominican RepublicEastern AfricaEastern AsiaEastern EuropeEcuadorEgyptEl SalvadorEnglandEritreaEthiopiaEuropeFijiFranceGermanyGhanaGreeceGrenadaGuatemalaGuyanaHaitiHondurasHong KongHungaryIndiaIndonesiaIranIraqIrelandIsraelItalyJamaicaJapanJordanKazakhstanKenyaKoreaKuwaitLaosLatin AmericaLatviaLebanonLiberiaLithuaniaMalaysiaMexicoMicronesiaMiddle AfricaMoldovaMoroccoNepalNetherlandsNicaraguaNigeriaNorth AmericaNorth MacedoniaNorthern AfricaNorthern EuropeNorwayOceaniaPakistanPanamaPeruPhilippinesPolandPortugalRomaniaRussiaSaudi ArabiaScotlandSenegalSerbiaSierra LeoneSingaporeSomaliaSouth AfricaSouth AmericaSouth Central AsiaSouth Eastern AsiaSouthern EuropeSpainSri LankaSt. Vincent and the GrenadinesSudanSwedenSwitzerlandSyriaTaiwanThailandTrinidad and TobagoTurkeyUgandaUkraineUruguayUzbekistanVenezuelaVietnamWest IndiesWestern AfricaWestern AsiaWestern EuropeYemenZaireZimbabweAzores
Select to Compare
Race
Ancestry
AfghanAfricanAlaska NativeAlaskan AthabascanAlbanianAleutAlsatianAmericanApacheArabArapahoArgentineanArmenianAssyrian/Chaldean/SyriacAustralianAustrianBahamianBangladeshiBarbadianBasqueBelgianBelizeanBermudanBhutaneseBlackfeetBolivianBrazilianBritishBritish West IndianBulgarianBurmeseCajunCambodianCanadianCape VerdeanCarpatho RusynCelticCentral AmericanCentral American IndianCherokeeCheyenneChickasawChileanChineseChippewaChoctawColombianColvilleComancheCosta RicanCreeCreekCroatianCrowCubanCypriotCzechCzechoslovakianDanishDelawareDominicanDutchDutch West IndianEastern EuropeanEcuadorianEgyptianEnglishEstonianEthiopianEuropeanFijianFilipinoFinnishFrenchFrench American IndianFrench CanadianGermanGerman RussianGhanaianGreekGuamanian/ChamorroGuatemalanGuyaneseHaitianHmongHonduranHopiHoumaHungarianIcelanderIndian (Asian)IndonesianInupiatIranianIraqiIrishIroquoisIsraeliItalianJamaicanJapaneseJordanianKenyanKiowaKoreanLaotianLatvianLebaneseLiberianLithuanianLumbeeLuxembourgerMacedonianMalaysianMalteseMarshalleseMenomineeMexicanMexican American IndianMongolianMoroccanNative HawaiianNavajoNepaleseNew ZealanderNicaraguanNigerianNorthern EuropeanNorwegianOkinawanOsageOttawaPaiutePakistaniPalestinianPanamanianParaguayanPennsylvania GermanPeruvianPimaPolishPortuguesePotawatomiPuebloPuerto RicanPuget Sound SalishRomanianRussianSalvadoranSamoanScandinavianScotch-IrishScottishSeminoleSenegaleseSerbianShoshoneSierra LeoneanSiouxSlavicSlovakSloveneSomaliSouth AfricanSouth AmericanSouth American IndianSoviet UnionSpaniardSpanishSpanish AmericanSpanish American IndianSri LankanSubsaharan AfricanSudaneseSwedishSwissSyrianTaiwaneseThaiTlingit-HaidaTohono O'OdhamTonganTrinidadian and TobagonianTsimshianTurkishU.S. Virgin IslanderUgandanUkrainianUruguayanUteVenezuelanVietnameseWelshWest IndianYakamaYaquiYugoslavianYumanYup'ikZimbabwean
Immigration
NonimmigrantsImmigrantsAfghanistanAfricaAlbaniaArgentinaArmeniaAsiaAustraliaAustriaBahamasBangladeshBarbadosBelarusBelgiumBelizeBoliviaBosnia and HerzegovinaBrazilBulgariaBurma/MyanmarCabo VerdeCambodiaCameroonCanadaCaribbeanCentral AmericaChileChinaColombiaCongoCosta RicaCroatiaCubaCzechoslovakiaDenmarkDominicaDominican RepublicEastern AfricaEastern AsiaEastern EuropeEcuadorEgyptEl SalvadorEnglandEritreaEthiopiaEuropeFijiFranceGermanyGhanaGreeceGrenadaGuatemalaGuyanaHaitiHondurasHong KongHungaryIndiaIndonesiaIranIraqIrelandIsraelItalyJamaicaJapanJordanKazakhstanKenyaKoreaKuwaitLaosLatin AmericaLatviaLebanonLiberiaLithuaniaMalaysiaMexicoMicronesiaMiddle AfricaMoldovaMoroccoNepalNetherlandsNicaraguaNigeriaNorth AmericaNorth MacedoniaNorthern AfricaNorthern EuropeNorwayOceaniaPakistanPanamaPeruPhilippinesPolandPortugalRomaniaRussiaSaudi ArabiaScotlandSenegalSerbiaSierra LeoneSingaporeSomaliaSouth AfricaSouth AmericaSouth Central AsiaSouth Eastern AsiaSouthern EuropeSpainSri LankaSt. Vincent and the GrenadinesSudanSwitzerlandSyriaTaiwanThailandTrinidad and TobagoTurkeyUgandaUkraineUruguayUzbekistanVenezuelaVietnamWest IndiesWestern AfricaWestern AsiaWestern EuropeYemenZaireZimbabweAzores
Disability
Income
Poverty
Unemployment
Labor Participation
Family Structure
Vehicle Availability
Education Level
Disability

Immigrants from Sweden Disability
Exceptional

11.0%
DISABILITY
99.6/ 100
METRIC RATING
64th/ 347
METRIC RANK

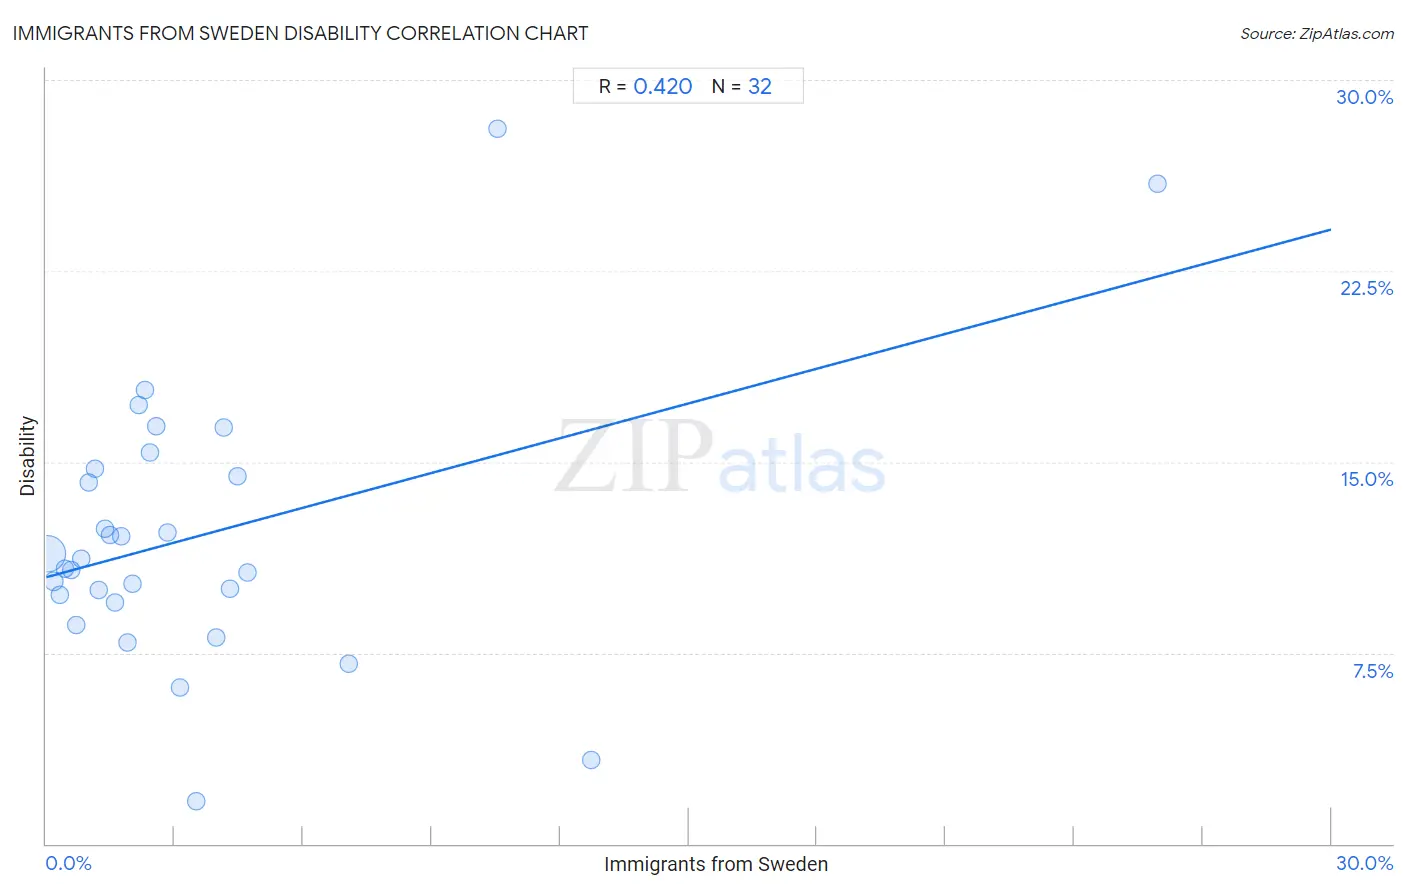
Immigrants from Sweden Disability Correlation Chart

The statistical analysis conducted on geographies consisting of 164,749,028 people shows a moderate positive correlation between the proportion of Immigrants from Sweden and percentage of population with a disability in the United States with a correlation coefficient (R) of 0.420 and weighted average of 11.0%. On average, for every 1% (one percent) increase in Immigrants from Sweden within a typical geography, there is an increase of 0.46% in percentage of population with a disability.
Immigrants from Sweden Disability
It is essential to understand that the correlation between the percentage of Immigrants from Sweden and percentage of population with a disability does not imply a direct cause-and-effect relationship. It remains uncertain whether the presence of Immigrants from Sweden influences an upward or downward trend in the level of percentage of population with a disability within an area, or if Immigrants from Sweden simply ended up residing in those areas with higher or lower levels of percentage of population with a disability due to other factors.

Demographics Similar to Immigrants from Sweden by Disability

In terms of disability, the demographic groups most similar to Immigrants from Sweden are Bulgarian (11.0%, a difference of 0.020%), Laotian (11.0%, a difference of 0.030%), Colombian (11.0%, a difference of 0.11%), Immigrants from Eritrea (11.0%, a difference of 0.18%), and Immigrants from Northern Africa (10.9%, a difference of 0.20%).
DemographicsRating | RankDisability
Salvadorans
99.8
/100
|
#57
Exceptional
10.9%
Immigrants from South America
99.8
/100
|
#58
Exceptional
10.9%
Immigrants from Colombia
99.7
/100
|
#59
Exceptional
10.9%
Zimbabweans
99.7
/100
|
#60
Exceptional
10.9%
Immigrants from Bulgaria
99.7
/100
|
#61
Exceptional
10.9%
Immigrants from Northern Africa
99.7
/100
|
#62
Exceptional
10.9%
Immigrants from Eritrea
99.7
/100
|
#63
Exceptional
11.0%
Immigrants from Sweden
99.6
/100
|
#64
Exceptional
11.0%
Bulgarians
99.6
/100
|
#65
Exceptional
11.0%
Laotians
99.6
/100
|
#66
Exceptional
11.0%
Colombians
99.6
/100
|
#67
Exceptional
11.0%
Immigrants from Afghanistan
99.6
/100
|
#68
Exceptional
11.0%
Sri Lankans
99.5
/100
|
#69
Exceptional
11.0%
Immigrants from France
99.4
/100
|
#70
Exceptional
11.0%
Immigrants from Lebanon
99.4
/100
|
#71
Exceptional
11.0%

Immigrants from Sweden Disability Correlation Summary

MeasurementImmigrants from Sweden DataDisability Data
Minimum0.033%1.7%
Maximum25.9%28.1%
Range25.9%26.4%
Mean3.5%12.1%
Median2.1%11.0%
Interquartile 25% (IQ1)1.1%9.6%
Interquartile 75% (IQ3)4.1%14.6%
Interquartile Range (IQR)3.0%4.9%
Standard Deviation (Sample)5.0%5.4%
Standard Deviation (Population)4.9%5.3%

Correlation Details

Immigrants from Sweden PercentileSample SizeDisability
[
0.0%
-
0.5%
]
0.033%
151,005,39911.4%
[
0.0%
-
0.5%
]
0.18%
9,538,05610.3%
[
0.0%
-
0.5%
]
0.31%
2,619,3009.8%
[
0.0%
-
0.5%
]
0.43%
827,41510.8%
[
0.5%
-
1.0%
]
0.59%
259,56510.8%
[
0.5%
-
1.0%
]
0.69%
206,5028.6%
[
0.5%
-
1.0%
]
0.82%
76,07411.2%
[
0.5%
-
1.0%
]
0.99%
49,76814.2%
[
1.0%
-
1.5%
]
1.13%
38,17214.7%
[
1.0%
-
1.5%
]
1.22%
32,66010.0%
[
1.0%
-
1.5%
]
1.36%
35,50812.4%
[
1.0%
-
1.5%
]
1.50%
10,68212.1%
[
1.5%
-
2.0%
]
1.62%
14,6669.5%
[
1.5%
-
2.0%
]
1.75%
15,16912.1%
[
1.5%
-
2.0%
]
1.91%
7337.9%
[
2.0%
-
2.5%
]
2.03%
5,47910.2%
[
2.0%
-
2.5%
]
2.16%
1,66717.2%
[
2.0%
-
2.5%
]
2.30%
34817.8%
[
2.0%
-
2.5%
]
2.43%
65815.3%
[
2.5%
-
3.0%
]
2.55%
27416.4%
[
2.5%
-
3.0%
]
2.83%
98912.2%
[
3.0%
-
3.5%
]
3.13%
2,0466.1%
[
3.0%
-
3.5%
]
3.49%
7161.7%
[
3.5%
-
4.0%
]
3.97%
3,9568.1%
[
4.0%
-
4.5%
]
4.13%
50816.3%
[
4.0%
-
4.5%
]
4.29%
21010.0%
[
4.0%
-
4.5%
]
4.46%
38114.4%
[
4.5%
-
5.0%
]
4.71%
1,23110.6%
[
7.0%
-
7.5%
]
7.07%
1987.1%
[
10.5%
-
11.0%
]
10.53%
5728.1%
[
12.5%
-
13.0%
]
12.72%
4563.3%
[
25.5%
-
26.0%
]
25.95%
18525.9%