Immigrants from Sweden Married-Couple Family Poverty

COMPARE

Immigrants from Sweden
Race
Ancestry
AfghanAfricanAlaska NativeAlaskan AthabascanAlbanianAleutAlsatianAmericanApacheArabArapahoArgentineanArmenianAssyrian/Chaldean/SyriacAustralianAustrianBahamianBangladeshiBarbadianBasqueBelgianBelizeanBermudanBhutaneseBlackfeetBolivianBrazilianBritishBritish West IndianBulgarianBurmeseCajunCambodianCanadianCape VerdeanCarpatho RusynCelticCentral AmericanCentral American IndianCherokeeCheyenneChickasawChileanChineseChippewaChoctawColombianColvilleComancheCosta RicanCreeCreekCroatianCrowCubanCypriotCzechCzechoslovakianDanishDelawareDominicanDutchDutch West IndianEastern EuropeanEcuadorianEgyptianEnglishEstonianEthiopianEuropeanFijianFilipinoFinnishFrenchFrench American IndianFrench CanadianGermanGerman RussianGhanaianGreekGuamanian/ChamorroGuatemalanGuyaneseHaitianHmongHonduranHopiHoumaHungarianIcelanderIndian (Asian)IndonesianInupiatIranianIraqiIrishIroquoisIsraeliItalianJamaicanJapaneseJordanianKenyanKiowaKoreanLaotianLatvianLebaneseLiberianLithuanianLumbeeLuxembourgerMacedonianMalaysianMalteseMarshalleseMenomineeMexicanMexican American IndianMongolianMoroccanNative HawaiianNavajoNepaleseNew ZealanderNicaraguanNigerianNorthern EuropeanNorwegianOkinawanOsageOttawaPaiutePakistaniPalestinianPanamanianParaguayanPennsylvania GermanPeruvianPimaPolishPortuguesePotawatomiPuebloPuerto RicanPuget Sound SalishRomanianRussianSalvadoranSamoanScandinavianScotch-IrishScottishSeminoleSenegaleseSerbianShoshoneSierra LeoneanSiouxSlavicSlovakSloveneSomaliSouth AfricanSouth AmericanSouth American IndianSoviet UnionSpaniardSpanishSpanish AmericanSpanish American IndianSri LankanSubsaharan AfricanSudaneseSwedishSwissSyrianTaiwaneseThaiTlingit-HaidaTohono O'OdhamTonganTrinidadian and TobagonianTsimshianTurkishU.S. Virgin IslanderUgandanUkrainianUruguayanUteVenezuelanVietnameseWelshWest IndianYakamaYaquiYugoslavianYumanYup'ikZimbabwean
Immigration
NonimmigrantsImmigrantsAfghanistanAfricaAlbaniaArgentinaArmeniaAsiaAustraliaAustriaBahamasBangladeshBarbadosBelarusBelgiumBelizeBoliviaBosnia and HerzegovinaBrazilBulgariaBurma/MyanmarCabo VerdeCambodiaCameroonCanadaCaribbeanCentral AmericaChileChinaColombiaCongoCosta RicaCroatiaCubaCzechoslovakiaDenmarkDominicaDominican RepublicEastern AfricaEastern AsiaEastern EuropeEcuadorEgyptEl SalvadorEnglandEritreaEthiopiaEuropeFijiFranceGermanyGhanaGreeceGrenadaGuatemalaGuyanaHaitiHondurasHong KongHungaryIndiaIndonesiaIranIraqIrelandIsraelItalyJamaicaJapanJordanKazakhstanKenyaKoreaKuwaitLaosLatin AmericaLatviaLebanonLiberiaLithuaniaMalaysiaMexicoMicronesiaMiddle AfricaMoldovaMoroccoNepalNetherlandsNicaraguaNigeriaNorth AmericaNorth MacedoniaNorthern AfricaNorthern EuropeNorwayOceaniaPakistanPanamaPeruPhilippinesPolandPortugalRomaniaRussiaSaudi ArabiaScotlandSenegalSerbiaSierra LeoneSingaporeSomaliaSouth AfricaSouth AmericaSouth Central AsiaSouth Eastern AsiaSouthern EuropeSpainSri LankaSt. Vincent and the GrenadinesSudanSwedenSwitzerlandSyriaTaiwanThailandTrinidad and TobagoTurkeyUgandaUkraineUruguayUzbekistanVenezuelaVietnamWest IndiesWestern AfricaWestern AsiaWestern EuropeYemenZaireZimbabweAzores
Select to Compare
Race
Ancestry
AfghanAfricanAlaska NativeAlaskan AthabascanAlbanianAleutAlsatianAmericanApacheArabArapahoArgentineanArmenianAssyrian/Chaldean/SyriacAustralianAustrianBahamianBangladeshiBarbadianBasqueBelgianBelizeanBermudanBhutaneseBlackfeetBolivianBrazilianBritishBritish West IndianBulgarianBurmeseCajunCambodianCanadianCape VerdeanCarpatho RusynCelticCentral AmericanCentral American IndianCherokeeCheyenneChickasawChileanChineseChippewaChoctawColombianColvilleComancheCosta RicanCreeCreekCroatianCrowCubanCypriotCzechCzechoslovakianDanishDelawareDominicanDutchDutch West IndianEastern EuropeanEcuadorianEgyptianEnglishEstonianEthiopianEuropeanFijianFilipinoFinnishFrenchFrench American IndianFrench CanadianGermanGerman RussianGhanaianGreekGuamanian/ChamorroGuatemalanGuyaneseHaitianHmongHonduranHopiHoumaHungarianIcelanderIndian (Asian)IndonesianInupiatIranianIraqiIrishIroquoisIsraeliItalianJamaicanJapaneseJordanianKenyanKiowaKoreanLaotianLatvianLebaneseLiberianLithuanianLumbeeLuxembourgerMacedonianMalaysianMalteseMarshalleseMenomineeMexicanMexican American IndianMongolianMoroccanNative HawaiianNavajoNepaleseNew ZealanderNicaraguanNigerianNorthern EuropeanNorwegianOkinawanOsageOttawaPaiutePakistaniPalestinianPanamanianParaguayanPennsylvania GermanPeruvianPimaPolishPortuguesePotawatomiPuebloPuerto RicanPuget Sound SalishRomanianRussianSalvadoranSamoanScandinavianScotch-IrishScottishSeminoleSenegaleseSerbianShoshoneSierra LeoneanSiouxSlavicSlovakSloveneSomaliSouth AfricanSouth AmericanSouth American IndianSoviet UnionSpaniardSpanishSpanish AmericanSpanish American IndianSri LankanSubsaharan AfricanSudaneseSwedishSwissSyrianTaiwaneseThaiTlingit-HaidaTohono O'OdhamTonganTrinidadian and TobagonianTsimshianTurkishU.S. Virgin IslanderUgandanUkrainianUruguayanUteVenezuelanVietnameseWelshWest IndianYakamaYaquiYugoslavianYumanYup'ikZimbabwean
Immigration
NonimmigrantsImmigrantsAfghanistanAfricaAlbaniaArgentinaArmeniaAsiaAustraliaAustriaBahamasBangladeshBarbadosBelarusBelgiumBelizeBoliviaBosnia and HerzegovinaBrazilBulgariaBurma/MyanmarCabo VerdeCambodiaCameroonCanadaCaribbeanCentral AmericaChileChinaColombiaCongoCosta RicaCroatiaCubaCzechoslovakiaDenmarkDominicaDominican RepublicEastern AfricaEastern AsiaEastern EuropeEcuadorEgyptEl SalvadorEnglandEritreaEthiopiaEuropeFijiFranceGermanyGhanaGreeceGrenadaGuatemalaGuyanaHaitiHondurasHong KongHungaryIndiaIndonesiaIranIraqIrelandIsraelItalyJamaicaJapanJordanKazakhstanKenyaKoreaKuwaitLaosLatin AmericaLatviaLebanonLiberiaLithuaniaMalaysiaMexicoMicronesiaMiddle AfricaMoldovaMoroccoNepalNetherlandsNicaraguaNigeriaNorth AmericaNorth MacedoniaNorthern AfricaNorthern EuropeNorwayOceaniaPakistanPanamaPeruPhilippinesPolandPortugalRomaniaRussiaSaudi ArabiaScotlandSenegalSerbiaSierra LeoneSingaporeSomaliaSouth AfricaSouth AmericaSouth Central AsiaSouth Eastern AsiaSouthern EuropeSpainSri LankaSt. Vincent and the GrenadinesSudanSwitzerlandSyriaTaiwanThailandTrinidad and TobagoTurkeyUgandaUkraineUruguayUzbekistanVenezuelaVietnamWest IndiesWestern AfricaWestern AsiaWestern EuropeYemenZaireZimbabweAzores
Married-Couple Family Poverty
Income
Poverty
Unemployment
Labor Participation
Family Structure
Vehicle Availability
Education Level
Disability

Immigrants from Sweden Married-Couple Family Poverty
Exceptional

4.4%
POVERTY | MARRIED-COUPLE FAMILIES
99.6/ 100
METRIC RATING
59th/ 347
METRIC RANK

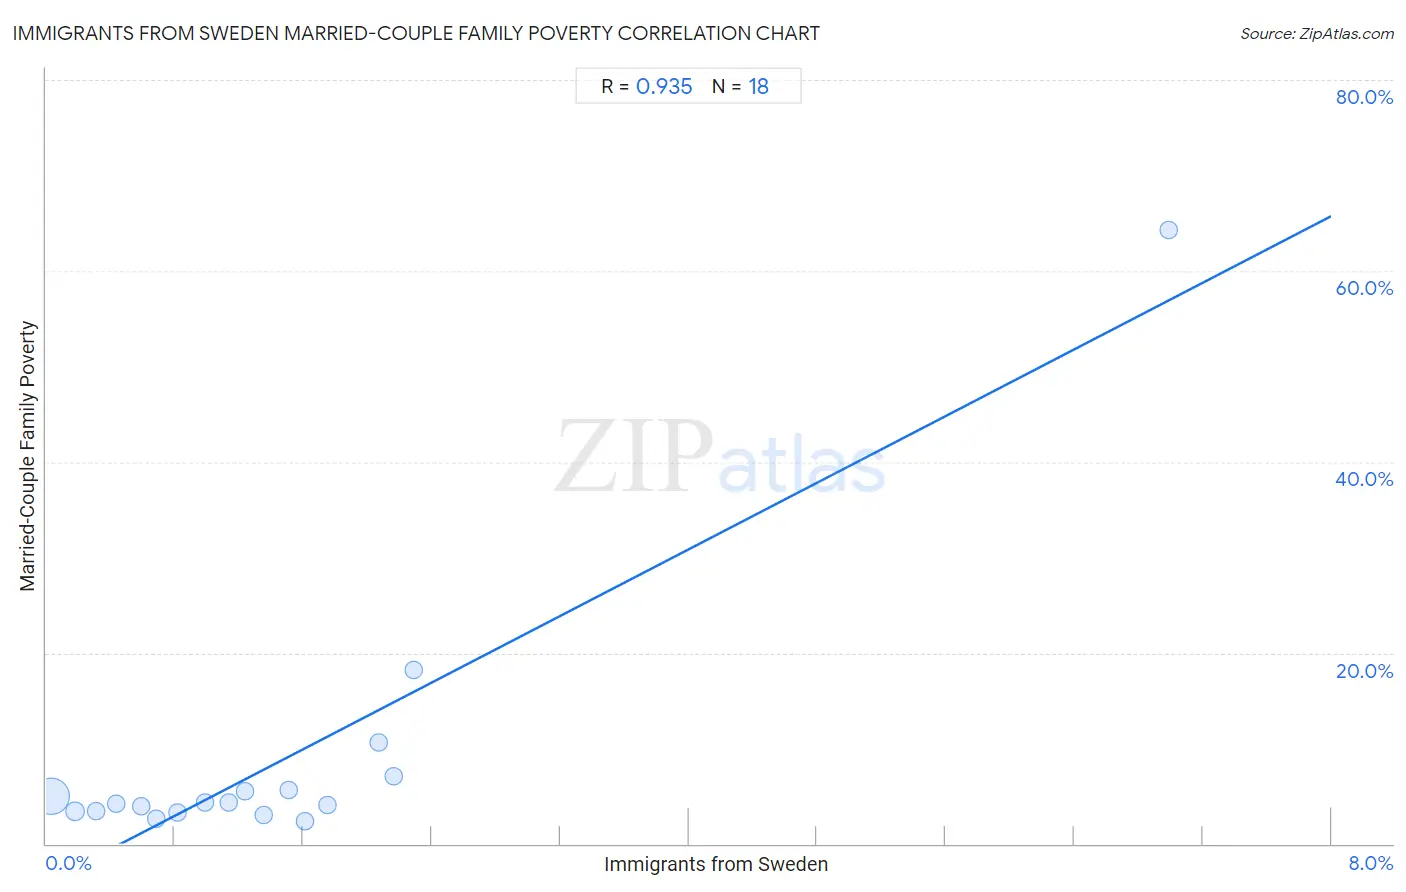
Immigrants from Sweden Married-Couple Family Poverty Correlation Chart

The statistical analysis conducted on geographies consisting of 164,054,157 people shows a near-perfect positive correlation between the proportion of Immigrants from Sweden and poverty level among married-couple families in the United States with a correlation coefficient (R) of 0.935 and weighted average of 4.4%. On average, for every 1% (one percent) increase in Immigrants from Sweden within a typical geography, there is an increase of 8.7% in poverty level among married-couple families.
Immigrants from Sweden Married-Couple Family Poverty
It is essential to understand that the correlation between the percentage of Immigrants from Sweden and poverty level among married-couple families does not imply a direct cause-and-effect relationship. It remains uncertain whether the presence of Immigrants from Sweden influences an upward or downward trend in the level of poverty level among married-couple families within an area, or if Immigrants from Sweden simply ended up residing in those areas with higher or lower levels of poverty level among married-couple families due to other factors.

Demographics Similar to Immigrants from Sweden by Married-Couple Family Poverty

In terms of married-couple family poverty, the demographic groups most similar to Immigrants from Sweden are Tlingit-Haida (4.4%, a difference of 0.070%), Okinawan (4.4%, a difference of 0.18%), Immigrants from Australia (4.4%, a difference of 0.19%), Czechoslovakian (4.4%, a difference of 0.55%), and Immigrants from Sri Lanka (4.4%, a difference of 0.56%).
DemographicsRating | RankMarried-Couple Family Poverty
Russians
99.7
/100
|
#52
Exceptional
4.3%
Welsh
99.7
/100
|
#53
Exceptional
4.3%
Austrians
99.7
/100
|
#54
Exceptional
4.3%
French
99.7
/100
|
#55
Exceptional
4.3%
Immigrants from Zimbabwe
99.7
/100
|
#56
Exceptional
4.3%
Immigrants from Netherlands
99.7
/100
|
#57
Exceptional
4.3%
Czechoslovakians
99.7
/100
|
#58
Exceptional
4.4%
Immigrants from Sweden
99.6
/100
|
#59
Exceptional
4.4%
Tlingit-Haida
99.6
/100
|
#60
Exceptional
4.4%
Okinawans
99.6
/100
|
#61
Exceptional
4.4%
Immigrants from Australia
99.6
/100
|
#62
Exceptional
4.4%
Immigrants from Sri Lanka
99.6
/100
|
#63
Exceptional
4.4%
Immigrants from Bulgaria
99.5
/100
|
#64
Exceptional
4.4%
Macedonians
99.4
/100
|
#65
Exceptional
4.4%
Immigrants from Serbia
99.4
/100
|
#66
Exceptional
4.4%

Immigrants from Sweden Married-Couple Family Poverty Correlation Summary

MeasurementImmigrants from Sweden DataMarried-Couple Family Poverty Data
Minimum0.033%2.4%
Maximum7.0%64.3%
Range7.0%61.9%
Mean1.5%8.6%
Median1.2%4.3%
Interquartile 25% (IQ1)0.59%3.4%
Interquartile 75% (IQ3)1.8%5.6%
Interquartile Range (IQR)1.2%2.2%
Standard Deviation (Sample)1.5%14.4%
Standard Deviation (Population)1.5%14.0%

Correlation Details

Immigrants from Sweden PercentileSample SizeMarried-Couple Family Poverty
[
0.0%
-
0.5%
]
0.033%
150,719,6054.9%
[
0.0%
-
0.5%
]
0.18%
9,382,6973.4%
[
0.0%
-
0.5%
]
0.31%
2,524,0243.4%
[
0.0%
-
0.5%
]
0.43%
796,8284.2%
[
0.5%
-
1.0%
]
0.59%
244,6953.9%
[
0.5%
-
1.0%
]
0.69%
158,2402.7%
[
0.5%
-
1.0%
]
0.82%
62,3343.3%
[
0.5%
-
1.0%
]
0.99%
39,4804.3%
[
1.0%
-
1.5%
]
1.14%
34,8414.3%
[
1.0%
-
1.5%
]
1.24%
18,6235.5%
[
1.0%
-
1.5%
]
1.36%
35,5083.0%
[
1.5%
-
2.0%
]
1.51%
7,0245.6%
[
1.5%
-
2.0%
]
1.61%
12,3422.4%
[
1.5%
-
2.0%
]
1.75%
15,1694.1%
[
2.0%
-
2.5%
]
2.07%
67610.6%
[
2.0%
-
2.5%
]
2.16%
1,6677.1%
[
2.0%
-
2.5%
]
2.29%
17518.2%
[
6.5%
-
7.0%
]
6.99%
22964.3%