Immigrants from Sweden 3 or more Vehicles in Household
COMPARE
Immigrants from Sweden
Select to Compare
3 or more Vehicles in Household
Immigrants from Sweden 3 or more Vehicles in Household
19.2%
3+ VEHICLES AVAILABLE
29.0/ 100
METRIC RATING
186th/ 347
METRIC RANK
Immigrants from Sweden 3 or more Vehicles in Household Correlation Chart
The statistical analysis conducted on geographies consisting of 164,661,279 people shows a poor positive correlation between the proportion of Immigrants from Sweden and percentage of households with 3 or more vehicles available in the United States with a correlation coefficient (R) of 0.189 and weighted average of 19.2%. On average, for every 1% (one percent) increase in Immigrants from Sweden within a typical geography, there is an increase of 0.70% in percentage of households with 3 or more vehicles available.
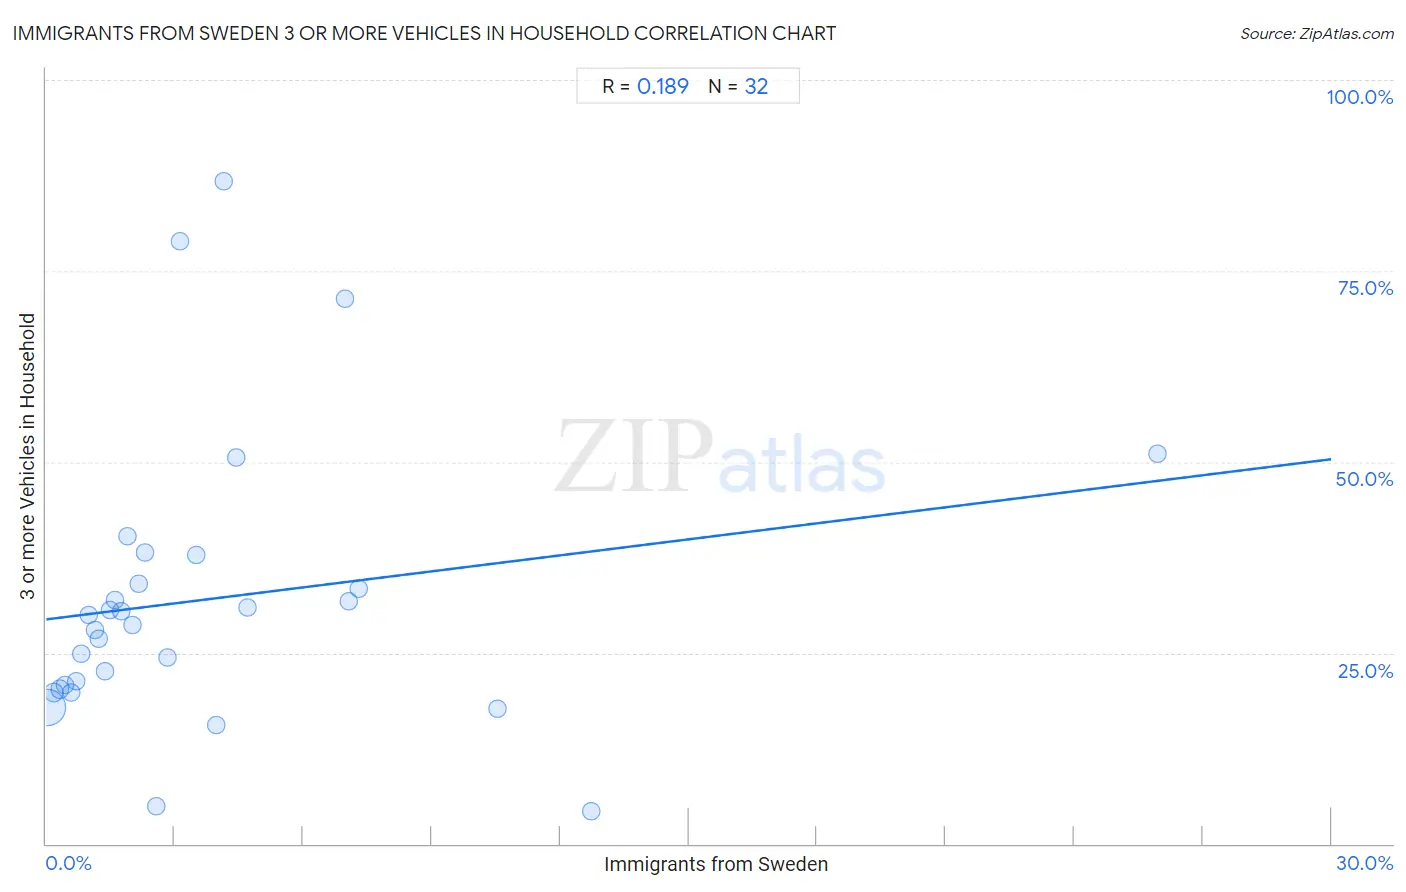
It is essential to understand that the correlation between the percentage of Immigrants from Sweden and percentage of households with 3 or more vehicles available does not imply a direct cause-and-effect relationship. It remains uncertain whether the presence of Immigrants from Sweden influences an upward or downward trend in the level of percentage of households with 3 or more vehicles available within an area, or if Immigrants from Sweden simply ended up residing in those areas with higher or lower levels of percentage of households with 3 or more vehicles available due to other factors.
Demographics Similar to Immigrants from Sweden by 3 or more Vehicles in Household
In terms of 3 or more vehicles in household, the demographic groups most similar to Immigrants from Sweden are Immigrants from Hong Kong (19.2%, a difference of 0.060%), Immigrants from Sri Lanka (19.2%, a difference of 0.16%), Immigrants from Kuwait (19.1%, a difference of 0.28%), Indian (Asian) (19.1%, a difference of 0.29%), and Immigrants from Zimbabwe (19.1%, a difference of 0.34%).
| Demographics | Rating | Rank | 3 or more Vehicles in Household |
| Immigrants from South Central Asia | 38.9 /100 | #179 | Fair 19.3% |
| South Africans | 37.5 /100 | #180 | Fair 19.3% |
| Romanians | 37.1 /100 | #181 | Fair 19.3% |
| Cubans | 36.6 /100 | #182 | Fair 19.3% |
| Cajuns | 36.0 /100 | #183 | Fair 19.3% |
| Latvians | 35.7 /100 | #184 | Fair 19.3% |
| Immigrants from Sri Lanka | 30.7 /100 | #185 | Fair 19.2% |
| Immigrants from Sweden | 29.0 /100 | #186 | Fair 19.2% |
| Immigrants from Hong Kong | 28.3 /100 | #187 | Fair 19.2% |
| Immigrants from Kuwait | 26.1 /100 | #188 | Fair 19.1% |
| Indians (Asian) | 26.0 /100 | #189 | Fair 19.1% |
| Immigrants from Zimbabwe | 25.5 /100 | #190 | Fair 19.1% |
| South American Indians | 25.4 /100 | #191 | Fair 19.1% |
| Kenyans | 24.7 /100 | #192 | Fair 19.1% |
| Tsimshian | 24.4 /100 | #193 | Fair 19.1% |
Immigrants from Sweden 3 or more Vehicles in Household Correlation Summary
| Measurement | Immigrants from Sweden Data | 3 or more Vehicles in Household Data |
| Minimum | 0.033% | 4.3% |
| Maximum | 25.9% | 86.7% |
| Range | 25.9% | 82.4% |
| Mean | 3.8% | 32.0% |
| Median | 2.1% | 29.2% |
| Interquartile 25% (IQ1) | 1.1% | 20.5% |
| Interquartile 75% (IQ3) | 4.3% | 35.9% |
| Interquartile Range (IQR) | 3.2% | 15.4% |
| Standard Deviation (Sample) | 5.0% | 18.6% |
| Standard Deviation (Population) | 5.0% | 18.3% |
Correlation Details
| Immigrants from Sweden Percentile | Sample Size | 3 or more Vehicles in Household |
[ 0.0% - 0.5% ] 0.033% | 150,981,735 | 17.9% |
[ 0.0% - 0.5% ] 0.18% | 9,501,449 | 19.7% |
[ 0.0% - 0.5% ] 0.31% | 2,608,739 | 20.2% |
[ 0.0% - 0.5% ] 0.43% | 817,897 | 20.9% |
[ 0.5% - 1.0% ] 0.59% | 258,225 | 19.9% |
[ 0.5% - 1.0% ] 0.69% | 202,536 | 21.2% |
[ 0.5% - 1.0% ] 0.82% | 76,074 | 24.9% |
[ 0.5% - 1.0% ] 0.99% | 49,768 | 29.9% |
[ 1.0% - 1.5% ] 1.14% | 36,514 | 28.0% |
[ 1.0% - 1.5% ] 1.22% | 32,660 | 26.8% |
[ 1.0% - 1.5% ] 1.36% | 35,508 | 22.5% |
[ 1.0% - 1.5% ] 1.50% | 10,682 | 30.5% |
[ 1.5% - 2.0% ] 1.62% | 15,084 | 31.8% |
[ 1.5% - 2.0% ] 1.75% | 15,169 | 30.4% |
[ 1.5% - 2.0% ] 1.91% | 733 | 40.2% |
[ 2.0% - 2.5% ] 2.03% | 5,479 | 28.6% |
[ 2.0% - 2.5% ] 2.16% | 1,667 | 34.0% |
[ 2.0% - 2.5% ] 2.30% | 348 | 38.1% |
[ 2.5% - 3.0% ] 2.55% | 274 | 4.9% |
[ 2.5% - 3.0% ] 2.83% | 989 | 24.3% |
[ 3.0% - 3.5% ] 3.13% | 1,855 | 78.8% |
[ 3.0% - 3.5% ] 3.49% | 716 | 37.8% |
[ 3.5% - 4.0% ] 3.97% | 3,956 | 15.5% |
[ 4.0% - 4.5% ] 4.13% | 508 | 86.7% |
[ 4.0% - 4.5% ] 4.44% | 180 | 50.6% |
[ 4.5% - 5.0% ] 4.71% | 1,231 | 30.9% |
[ 6.5% - 7.0% ] 6.99% | 229 | 71.4% |
[ 7.0% - 7.5% ] 7.07% | 198 | 31.7% |
[ 7.0% - 7.5% ] 7.30% | 178 | 33.3% |
[ 10.5% - 11.0% ] 10.53% | 57 | 17.6% |
[ 12.5% - 13.0% ] 12.72% | 456 | 4.3% |
[ 25.5% - 26.0% ] 25.95% | 185 | 51.0% |