Immigrants from Sweden vs Guamanian/Chamorro Disability Age 5 to 17

COMPARE

Immigrants from Sweden
Race
Ancestry
AfghanAfricanAlaska NativeAlaskan AthabascanAlbanianAleutAlsatianAmericanApacheArabArapahoArgentineanArmenianAssyrian/Chaldean/SyriacAustralianAustrianBahamianBangladeshiBarbadianBasqueBelgianBelizeanBermudanBhutaneseBlackfeetBolivianBrazilianBritishBritish West IndianBulgarianBurmeseCajunCambodianCanadianCape VerdeanCarpatho RusynCelticCentral AmericanCentral American IndianCherokeeCheyenneChickasawChileanChineseChippewaChoctawColombianColvilleComancheCosta RicanCreeCreekCroatianCrowCubanCypriotCzechCzechoslovakianDanishDelawareDominicanDutchDutch West IndianEastern EuropeanEcuadorianEgyptianEnglishEstonianEthiopianEuropeanFijianFilipinoFinnishFrenchFrench American IndianFrench CanadianGermanGerman RussianGhanaianGreekGuatemalanGuyaneseHaitianHmongHonduranHopiHoumaHungarianIcelanderIndian (Asian)IndonesianInupiatIranianIraqiIrishIroquoisIsraeliItalianJamaicanJapaneseJordanianKenyanKiowaKoreanLaotianLatvianLebaneseLiberianLithuanianLumbeeLuxembourgerMacedonianMalaysianMalteseMarshalleseMenomineeMexicanMexican American IndianMongolianMoroccanNative HawaiianNavajoNepaleseNew ZealanderNicaraguanNigerianNorthern EuropeanNorwegianOkinawanOsageOttawaPaiutePakistaniPalestinianPanamanianParaguayanPennsylvania GermanPeruvianPimaPolishPortuguesePotawatomiPuebloPuerto RicanPuget Sound SalishRomanianRussianSalvadoranSamoanScandinavianScotch-IrishScottishSeminoleSenegaleseSerbianShoshoneSierra LeoneanSiouxSlavicSlovakSloveneSomaliSouth AfricanSouth AmericanSouth American IndianSoviet UnionSpaniardSpanishSpanish AmericanSpanish American IndianSri LankanSubsaharan AfricanSudaneseSwedishSwissSyrianTaiwaneseThaiTlingit-HaidaTohono O'OdhamTonganTrinidadian and TobagonianTsimshianTurkishU.S. Virgin IslanderUgandanUkrainianUruguayanUteVenezuelanVietnameseWelshWest IndianYakamaYaquiYugoslavianYumanYup'ikZimbabwean
Immigration
NonimmigrantsImmigrantsAfghanistanAfricaAlbaniaArgentinaArmeniaAsiaAustraliaAustriaBahamasBangladeshBarbadosBelarusBelgiumBelizeBoliviaBosnia and HerzegovinaBrazilBulgariaBurma/MyanmarCabo VerdeCambodiaCameroonCanadaCaribbeanCentral AmericaChileChinaColombiaCongoCosta RicaCroatiaCubaCzechoslovakiaDenmarkDominicaDominican RepublicEastern AfricaEastern AsiaEastern EuropeEcuadorEgyptEl SalvadorEnglandEritreaEthiopiaEuropeFijiFranceGermanyGhanaGreeceGrenadaGuatemalaGuyanaHaitiHondurasHong KongHungaryIndiaIndonesiaIranIraqIrelandIsraelItalyJamaicaJapanJordanKazakhstanKenyaKoreaKuwaitLaosLatin AmericaLatviaLebanonLiberiaLithuaniaMalaysiaMexicoMicronesiaMiddle AfricaMoldovaMoroccoNepalNetherlandsNicaraguaNigeriaNorth AmericaNorth MacedoniaNorthern AfricaNorthern EuropeNorwayOceaniaPakistanPanamaPeruPhilippinesPolandPortugalRomaniaRussiaSaudi ArabiaScotlandSenegalSerbiaSierra LeoneSingaporeSomaliaSouth AfricaSouth AmericaSouth Central AsiaSouth Eastern AsiaSouthern EuropeSpainSri LankaSt. Vincent and the GrenadinesSudanSwedenSwitzerlandSyriaTaiwanThailandTrinidad and TobagoTurkeyUgandaUkraineUruguayUzbekistanVenezuelaVietnamWest IndiesWestern AfricaWestern AsiaWestern EuropeYemenZaireZimbabweAzores
Guamanian/Chamorro
Race
Ancestry
AfghanAfricanAlaska NativeAlaskan AthabascanAlbanianAleutAlsatianAmericanApacheArabArapahoArgentineanArmenianAssyrian/Chaldean/SyriacAustralianAustrianBahamianBangladeshiBarbadianBasqueBelgianBelizeanBermudanBhutaneseBlackfeetBolivianBrazilianBritishBritish West IndianBulgarianBurmeseCajunCambodianCanadianCape VerdeanCarpatho RusynCelticCentral AmericanCentral American IndianCherokeeCheyenneChickasawChileanChineseChippewaChoctawColombianColvilleComancheCosta RicanCreeCreekCroatianCrowCubanCypriotCzechCzechoslovakianDanishDelawareDominicanDutchDutch West IndianEastern EuropeanEcuadorianEgyptianEnglishEstonianEthiopianEuropeanFijianFilipinoFinnishFrenchFrench American IndianFrench CanadianGermanGerman RussianGhanaianGreekGuamanian/ChamorroGuatemalanGuyaneseHaitianHmongHonduranHopiHoumaHungarianIcelanderIndian (Asian)IndonesianInupiatIranianIraqiIrishIroquoisIsraeliItalianJamaicanJapaneseJordanianKenyanKiowaKoreanLaotianLatvianLebaneseLiberianLithuanianLumbeeLuxembourgerMacedonianMalaysianMalteseMarshalleseMenomineeMexicanMexican American IndianMongolianMoroccanNative HawaiianNavajoNepaleseNew ZealanderNicaraguanNigerianNorthern EuropeanNorwegianOkinawanOsageOttawaPaiutePakistaniPalestinianPanamanianParaguayanPennsylvania GermanPeruvianPimaPolishPortuguesePotawatomiPuebloPuerto RicanPuget Sound SalishRomanianRussianSalvadoranSamoanScandinavianScotch-IrishScottishSeminoleSenegaleseSerbianShoshoneSierra LeoneanSiouxSlavicSlovakSloveneSomaliSouth AfricanSouth AmericanSouth American IndianSoviet UnionSpaniardSpanishSpanish AmericanSpanish American IndianSri LankanSubsaharan AfricanSudaneseSwedishSwissSyrianTaiwaneseThaiTlingit-HaidaTohono O'OdhamTonganTrinidadian and TobagonianTsimshianTurkishU.S. Virgin IslanderUgandanUkrainianUruguayanUteVenezuelanVietnameseWelshWest IndianYakamaYaquiYugoslavianYumanYup'ikZimbabwean
Immigration
NonimmigrantsImmigrantsAfghanistanAfricaAlbaniaArgentinaArmeniaAsiaAustraliaAustriaBahamasBangladeshBarbadosBelarusBelgiumBelizeBoliviaBosnia and HerzegovinaBrazilBulgariaBurma/MyanmarCabo VerdeCambodiaCameroonCanadaCaribbeanCentral AmericaChileChinaColombiaCongoCosta RicaCroatiaCubaCzechoslovakiaDenmarkDominicaDominican RepublicEastern AfricaEastern AsiaEastern EuropeEcuadorEgyptEl SalvadorEnglandEritreaEthiopiaEuropeFijiFranceGermanyGhanaGreeceGrenadaGuatemalaGuyanaHaitiHondurasHong KongHungaryIndiaIndonesiaIranIraqIrelandIsraelItalyJamaicaJapanJordanKazakhstanKenyaKoreaKuwaitLaosLatin AmericaLatviaLebanonLiberiaLithuaniaMalaysiaMexicoMicronesiaMiddle AfricaMoldovaMoroccoNepalNetherlandsNicaraguaNigeriaNorth AmericaNorth MacedoniaNorthern AfricaNorthern EuropeNorwayOceaniaPakistanPanamaPeruPhilippinesPolandPortugalRomaniaRussiaSaudi ArabiaScotlandSenegalSerbiaSierra LeoneSingaporeSomaliaSouth AfricaSouth AmericaSouth Central AsiaSouth Eastern AsiaSouthern EuropeSpainSri LankaSt. Vincent and the GrenadinesSudanSwitzerlandSyriaTaiwanThailandTrinidad and TobagoTurkeyUgandaUkraineUruguayUzbekistanVenezuelaVietnamWest IndiesWestern AfricaWestern AsiaWestern EuropeYemenZaireZimbabweAzores
Disability Age 5 to 17
Income
Poverty
Unemployment
Labor Participation
Family Structure
Vehicle Availability
Education Level
Disability

Disability Age 5 to 17 Comparison

Immigrants from Sweden

Guamanians/Chamorros

Exceptional
Tragic
5.2%
DISABILITY AGE 5 TO 17
99.5/ 100
METRIC RATING
82nd/ 347
METRIC RANK
5.8%
DISABILITY AGE 5 TO 17
5.6/ 100
METRIC RATING
225th/ 347
METRIC RANK

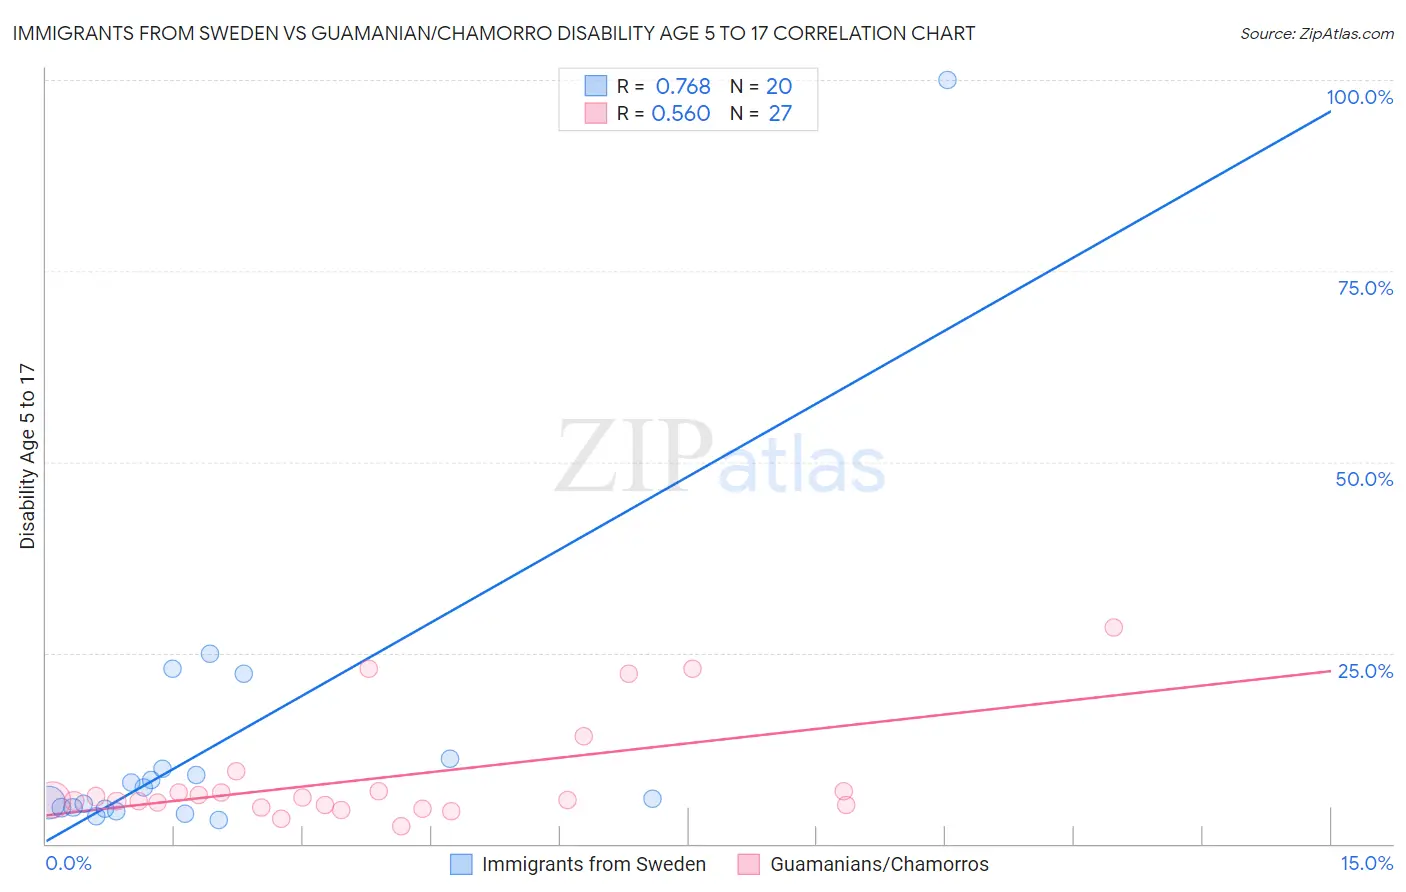
Immigrants from Sweden vs Guamanian/Chamorro Disability Age 5 to 17 Correlation Chart

The statistical analysis conducted on geographies consisting of 163,789,898 people shows a strong positive correlation between the proportion of Immigrants from Sweden and percentage of population with a disability between the ages 5 and 17 in the United States with a correlation coefficient (R) of 0.768 and weighted average of 5.2%. Similarly, the statistical analysis conducted on geographies consisting of 221,078,318 people shows a substantial positive correlation between the proportion of Guamanians/Chamorros and percentage of population with a disability between the ages 5 and 17 in the United States with a correlation coefficient (R) of 0.560 and weighted average of 5.8%, a difference of 10.8%.
Immigrants from Sweden vs Guamanian/Chamorro Disability Age 5 to 17

Disability Age 5 to 17 Correlation Summary

MeasurementImmigrants from SwedenGuamanian/Chamorro
Minimum3.1%2.3%
Maximum100.0%28.2%
Range96.9%26.0%
Mean13.5%8.6%
Median6.6%5.7%
Interquartile 25% (IQ1)4.7%5.0%
Interquartile 75% (IQ3)10.4%6.9%
Interquartile Range (IQR)5.8%1.9%
Standard Deviation (Sample)21.4%7.0%
Standard Deviation (Population)20.9%6.8%

Similar Demographics by Disability Age 5 to 17

Demographics Similar to Immigrants from Sweden by Disability Age 5 to 17

In terms of disability age 5 to 17, the demographic groups most similar to Immigrants from Sweden are Immigrants from France (5.2%, a difference of 0.090%), Native Hawaiian (5.2%, a difference of 0.11%), Sri Lankan (5.2%, a difference of 0.15%), Immigrants from Nicaragua (5.2%, a difference of 0.16%), and Afghan (5.2%, a difference of 0.17%).
DemographicsRating | RankDisability Age 5 to 17
Immigrants | Moldova
99.6
/100
|
#75
Exceptional
5.2%
Immigrants | Guyana
99.6
/100
|
#76
Exceptional
5.2%
Immigrants | Kazakhstan
99.6
/100
|
#77
Exceptional
5.2%
Immigrants | Cuba
99.6
/100
|
#78
Exceptional
5.2%
Afghans
99.6
/100
|
#79
Exceptional
5.2%
Sri Lankans
99.6
/100
|
#80
Exceptional
5.2%
Native Hawaiians
99.6
/100
|
#81
Exceptional
5.2%
Immigrants | Sweden
99.5
/100
|
#82
Exceptional
5.2%
Immigrants | France
99.5
/100
|
#83
Exceptional
5.2%
Immigrants | Nicaragua
99.5
/100
|
#84
Exceptional
5.2%
Bulgarians
99.4
/100
|
#85
Exceptional
5.2%
Immigrants | St. Vincent and the Grenadines
99.4
/100
|
#86
Exceptional
5.2%
Eastern Europeans
99.4
/100
|
#87
Exceptional
5.2%
Immigrants | Croatia
99.4
/100
|
#88
Exceptional
5.2%
Immigrants | Spain
99.4
/100
|
#89
Exceptional
5.2%

Demographics Similar to Guamanians/Chamorros by Disability Age 5 to 17

In terms of disability age 5 to 17, the demographic groups most similar to Guamanians/Chamorros are Mexican (5.8%, a difference of 0.020%), British West Indian (5.8%, a difference of 0.040%), Alsatian (5.8%, a difference of 0.080%), Swiss (5.8%, a difference of 0.12%), and Haitian (5.8%, a difference of 0.20%).
DemographicsRating | RankDisability Age 5 to 17
Immigrants | Sierra Leone
7.1
/100
|
#218
Tragic
5.8%
Sierra Leoneans
7.0
/100
|
#219
Tragic
5.8%
Belgians
6.9
/100
|
#220
Tragic
5.8%
Lithuanians
6.7
/100
|
#221
Tragic
5.8%
Immigrants | Sudan
6.7
/100
|
#222
Tragic
5.8%
Alsatians
6.0
/100
|
#223
Tragic
5.8%
Mexicans
5.7
/100
|
#224
Tragic
5.8%
Guamanians/Chamorros
5.6
/100
|
#225
Tragic
5.8%
British West Indians
5.4
/100
|
#226
Tragic
5.8%
Swiss
5.1
/100
|
#227
Tragic
5.8%
Haitians
4.8
/100
|
#228
Tragic
5.8%
Bangladeshis
4.8
/100
|
#229
Tragic
5.8%
Ghanaians
4.7
/100
|
#230
Tragic
5.8%
Europeans
4.5
/100
|
#231
Tragic
5.8%
Immigrants | Laos
3.8
/100
|
#232
Tragic
5.8%