Arab Self-Care Disability

COMPARE

Arab
Race
Ancestry
AfghanAfricanAlaska NativeAlaskan AthabascanAlbanianAleutAlsatianAmericanApacheArabArapahoArgentineanArmenianAssyrian/Chaldean/SyriacAustralianAustrianBahamianBangladeshiBarbadianBasqueBelgianBelizeanBermudanBhutaneseBlackfeetBolivianBrazilianBritishBritish West IndianBulgarianBurmeseCajunCambodianCanadianCape VerdeanCarpatho RusynCelticCentral AmericanCentral American IndianCherokeeCheyenneChickasawChileanChineseChippewaChoctawColombianColvilleComancheCosta RicanCreeCreekCroatianCrowCubanCypriotCzechCzechoslovakianDanishDelawareDominicanDutchDutch West IndianEastern EuropeanEcuadorianEgyptianEnglishEstonianEthiopianEuropeanFijianFilipinoFinnishFrenchFrench American IndianFrench CanadianGermanGerman RussianGhanaianGreekGuamanian/ChamorroGuatemalanGuyaneseHaitianHmongHonduranHopiHoumaHungarianIcelanderIndian (Asian)IndonesianInupiatIranianIraqiIrishIroquoisIsraeliItalianJamaicanJapaneseJordanianKenyanKiowaKoreanLaotianLatvianLebaneseLiberianLithuanianLumbeeLuxembourgerMacedonianMalaysianMalteseMarshalleseMenomineeMexicanMexican American IndianMongolianMoroccanNative HawaiianNavajoNepaleseNew ZealanderNicaraguanNigerianNorthern EuropeanNorwegianOkinawanOsageOttawaPaiutePakistaniPalestinianPanamanianParaguayanPennsylvania GermanPeruvianPimaPolishPortuguesePotawatomiPuebloPuerto RicanPuget Sound SalishRomanianRussianSalvadoranSamoanScandinavianScotch-IrishScottishSeminoleSenegaleseSerbianShoshoneSierra LeoneanSiouxSlavicSlovakSloveneSomaliSouth AfricanSouth AmericanSouth American IndianSoviet UnionSpaniardSpanishSpanish AmericanSpanish American IndianSri LankanSubsaharan AfricanSudaneseSwedishSwissSyrianTaiwaneseThaiTlingit-HaidaTohono O'OdhamTonganTrinidadian and TobagonianTsimshianTurkishU.S. Virgin IslanderUgandanUkrainianUruguayanUteVenezuelanVietnameseWelshWest IndianYakamaYaquiYugoslavianYumanYup'ikZimbabwean
Immigration
NonimmigrantsImmigrantsAfghanistanAfricaAlbaniaArgentinaArmeniaAsiaAustraliaAustriaBahamasBangladeshBarbadosBelarusBelgiumBelizeBoliviaBosnia and HerzegovinaBrazilBulgariaBurma/MyanmarCabo VerdeCambodiaCameroonCanadaCaribbeanCentral AmericaChileChinaColombiaCongoCosta RicaCroatiaCubaCzechoslovakiaDenmarkDominicaDominican RepublicEastern AfricaEastern AsiaEastern EuropeEcuadorEgyptEl SalvadorEnglandEritreaEthiopiaEuropeFijiFranceGermanyGhanaGreeceGrenadaGuatemalaGuyanaHaitiHondurasHong KongHungaryIndiaIndonesiaIranIraqIrelandIsraelItalyJamaicaJapanJordanKazakhstanKenyaKoreaKuwaitLaosLatin AmericaLatviaLebanonLiberiaLithuaniaMalaysiaMexicoMicronesiaMiddle AfricaMoldovaMoroccoNepalNetherlandsNicaraguaNigeriaNorth AmericaNorth MacedoniaNorthern AfricaNorthern EuropeNorwayOceaniaPakistanPanamaPeruPhilippinesPolandPortugalRomaniaRussiaSaudi ArabiaScotlandSenegalSerbiaSierra LeoneSingaporeSomaliaSouth AfricaSouth AmericaSouth Central AsiaSouth Eastern AsiaSouthern EuropeSpainSri LankaSt. Vincent and the GrenadinesSudanSwedenSwitzerlandSyriaTaiwanThailandTrinidad and TobagoTurkeyUgandaUkraineUruguayUzbekistanVenezuelaVietnamWest IndiesWestern AfricaWestern AsiaWestern EuropeYemenZaireZimbabweAzores
Select to Compare
Race
Ancestry
AfghanAfricanAlaska NativeAlaskan AthabascanAlbanianAleutAlsatianAmericanApacheArapahoArgentineanArmenianAssyrian/Chaldean/SyriacAustralianAustrianBahamianBangladeshiBarbadianBasqueBelgianBelizeanBermudanBhutaneseBlackfeetBolivianBrazilianBritishBritish West IndianBulgarianBurmeseCajunCambodianCanadianCape VerdeanCarpatho RusynCelticCentral AmericanCentral American IndianCherokeeCheyenneChickasawChileanChineseChippewaChoctawColombianColvilleComancheCosta RicanCreeCreekCroatianCrowCubanCypriotCzechCzechoslovakianDanishDelawareDominicanDutchDutch West IndianEastern EuropeanEcuadorianEgyptianEnglishEstonianEthiopianEuropeanFijianFilipinoFinnishFrenchFrench American IndianFrench CanadianGermanGerman RussianGhanaianGreekGuamanian/ChamorroGuatemalanGuyaneseHaitianHmongHonduranHopiHoumaHungarianIcelanderIndian (Asian)IndonesianInupiatIranianIraqiIrishIroquoisIsraeliItalianJamaicanJapaneseJordanianKenyanKiowaKoreanLaotianLatvianLebaneseLiberianLithuanianLumbeeLuxembourgerMacedonianMalaysianMalteseMarshalleseMenomineeMexicanMexican American IndianMongolianMoroccanNative HawaiianNavajoNepaleseNew ZealanderNicaraguanNigerianNorthern EuropeanNorwegianOkinawanOsageOttawaPaiutePakistaniPalestinianPanamanianParaguayanPennsylvania GermanPeruvianPimaPolishPortuguesePotawatomiPuebloPuerto RicanPuget Sound SalishRomanianRussianSalvadoranSamoanScandinavianScotch-IrishScottishSeminoleSenegaleseSerbianShoshoneSierra LeoneanSiouxSlavicSlovakSloveneSomaliSouth AfricanSouth AmericanSouth American IndianSoviet UnionSpaniardSpanishSpanish AmericanSpanish American IndianSri LankanSubsaharan AfricanSudaneseSwedishSwissSyrianTaiwaneseThaiTlingit-HaidaTohono O'OdhamTonganTrinidadian and TobagonianTsimshianTurkishU.S. Virgin IslanderUgandanUkrainianUruguayanUteVenezuelanVietnameseWelshWest IndianYakamaYaquiYugoslavianYumanYup'ikZimbabwean
Immigration
NonimmigrantsImmigrantsAfghanistanAfricaAlbaniaArgentinaArmeniaAsiaAustraliaAustriaBahamasBangladeshBarbadosBelarusBelgiumBelizeBoliviaBosnia and HerzegovinaBrazilBulgariaBurma/MyanmarCabo VerdeCambodiaCameroonCanadaCaribbeanCentral AmericaChileChinaColombiaCongoCosta RicaCroatiaCubaCzechoslovakiaDenmarkDominicaDominican RepublicEastern AfricaEastern AsiaEastern EuropeEcuadorEgyptEl SalvadorEnglandEritreaEthiopiaEuropeFijiFranceGermanyGhanaGreeceGrenadaGuatemalaGuyanaHaitiHondurasHong KongHungaryIndiaIndonesiaIranIraqIrelandIsraelItalyJamaicaJapanJordanKazakhstanKenyaKoreaKuwaitLaosLatin AmericaLatviaLebanonLiberiaLithuaniaMalaysiaMexicoMicronesiaMiddle AfricaMoldovaMoroccoNepalNetherlandsNicaraguaNigeriaNorth AmericaNorth MacedoniaNorthern AfricaNorthern EuropeNorwayOceaniaPakistanPanamaPeruPhilippinesPolandPortugalRomaniaRussiaSaudi ArabiaScotlandSenegalSerbiaSierra LeoneSingaporeSomaliaSouth AfricaSouth AmericaSouth Central AsiaSouth Eastern AsiaSouthern EuropeSpainSri LankaSt. Vincent and the GrenadinesSudanSwedenSwitzerlandSyriaTaiwanThailandTrinidad and TobagoTurkeyUgandaUkraineUruguayUzbekistanVenezuelaVietnamWest IndiesWestern AfricaWestern AsiaWestern EuropeYemenZaireZimbabweAzores
Self-Care Disability
Income
Poverty
Unemployment
Labor Participation
Family Structure
Vehicle Availability
Education Level
Disability

Arab Self-Care Disability
Good

2.4%
SELF-CARE DISABILITY
75.7/ 100
METRIC RATING
149th/ 347
METRIC RANK

Arab Self-Care Disability Correlation Chart

The statistical analysis conducted on geographies consisting of 485,999,863 people shows a poor positive correlation between the proportion of Arabs and percentage of population with self-care disability in the United States with a correlation coefficient (R) of 0.110 and weighted average of 2.4%. On average, for every 1% (one percent) increase in Arabs within a typical geography, there is an increase of 0.012% in percentage of population with self-care disability.
Arab Self-Care Disability
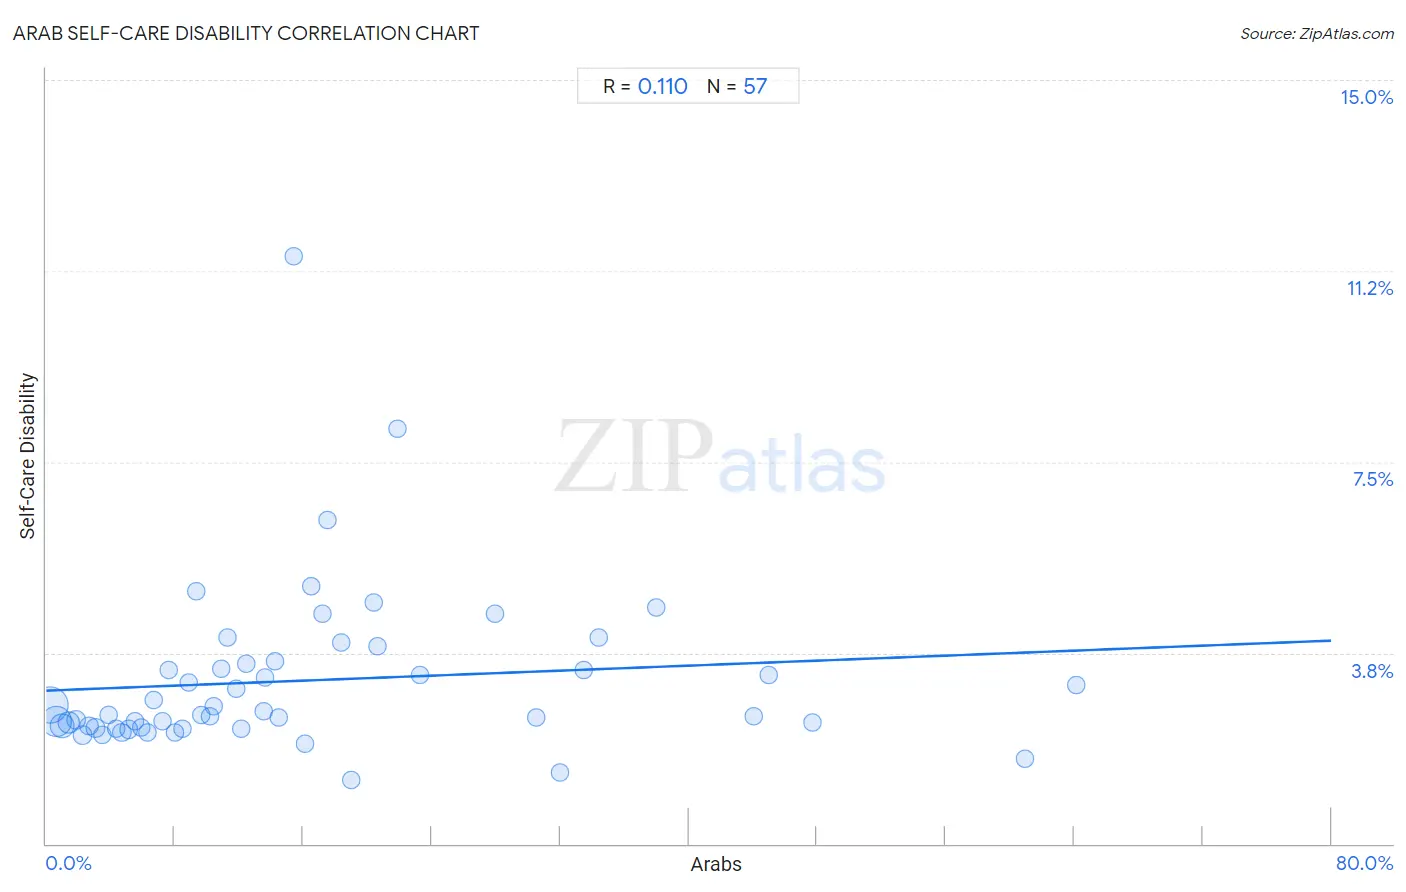
It is essential to understand that the correlation between the percentage of Arabs and percentage of population with self-care disability does not imply a direct cause-and-effect relationship. It remains uncertain whether the presence of Arabs influences an upward or downward trend in the level of percentage of population with self-care disability within an area, or if Arabs simply ended up residing in those areas with higher or lower levels of percentage of population with self-care disability due to other factors.

Demographics Similar to Arabs by Self-Care Disability

In terms of self-care disability, the demographic groups most similar to Arabs are Romanian (2.4%, a difference of 0.010%), Immigrants from Costa Rica (2.4%, a difference of 0.040%), Basque (2.4%, a difference of 0.11%), Dutch (2.4%, a difference of 0.12%), and Tlingit-Haida (2.4%, a difference of 0.14%).
DemographicsRating | RankSelf-Care Disability
Immigrants from Peru
83.2
/100
|
#142
Excellent
2.4%
Afghans
82.3
/100
|
#143
Excellent
2.4%
Costa Ricans
80.8
/100
|
#144
Excellent
2.4%
Germans
80.1
/100
|
#145
Excellent
2.4%
Israelis
80.0
/100
|
#146
Good
2.4%
Dutch
77.5
/100
|
#147
Good
2.4%
Romanians
75.8
/100
|
#148
Good
2.4%
Arabs
75.7
/100
|
#149
Good
2.4%
Immigrants from Costa Rica
75.1
/100
|
#150
Good
2.4%
Basques
74.0
/100
|
#151
Good
2.4%
Tlingit-Haida
73.5
/100
|
#152
Good
2.4%
Immigrants from England
73.5
/100
|
#153
Good
2.4%
Italians
72.2
/100
|
#154
Good
2.4%
Pakistanis
71.4
/100
|
#155
Good
2.4%
Nigerians
70.6
/100
|
#156
Good
2.4%

Arab Self-Care Disability Correlation Summary

MeasurementArab DataSelf-Care Disability Data
Minimum0.20%1.3%
Maximum64.1%11.5%
Range63.9%10.3%
Mean16.1%3.2%
Median11.8%2.5%
Interquartile 25% (IQ1)5.7%2.3%
Interquartile 75% (IQ3)20.5%3.6%
Interquartile Range (IQR)14.8%1.3%
Standard Deviation (Sample)14.7%1.6%
Standard Deviation (Population)14.6%1.6%

Correlation Details

Arab PercentileSample SizeSelf-Care Disability
[
0.0%
-
0.5%
]
0.20%
197,148,8222.7%
[
0.5%
-
1.0%
]
0.61%
128,043,6842.4%
[
0.5%
-
1.0%
]
1.00%
73,858,6012.3%
[
1.0%
-
1.5%
]
1.39%
39,453,4242.4%
[
1.5%
-
2.0%
]
1.84%
15,904,2632.4%
[
2.0%
-
2.5%
]
2.24%
11,160,7282.1%
[
2.5%
-
3.0%
]
2.67%
6,862,2332.3%
[
3.0%
-
3.5%
]
3.06%
3,293,2892.3%
[
3.0%
-
3.5%
]
3.50%
2,097,5142.1%
[
3.5%
-
4.0%
]
3.87%
2,135,6652.5%
[
4.0%
-
4.5%
]
4.32%
936,3982.2%
[
4.5%
-
5.0%
]
4.71%
839,3692.2%
[
5.0%
-
5.5%
]
5.12%
679,8472.2%
[
5.5%
-
6.0%
]
5.54%
440,4522.4%
[
5.5%
-
6.0%
]
5.93%
219,4272.3%
[
6.0%
-
6.5%
]
6.31%
414,4832.2%
[
6.5%
-
7.0%
]
6.67%
282,8942.8%
[
7.0%
-
7.5%
]
7.24%
140,8792.4%
[
7.5%
-
8.0%
]
7.64%
281,9703.4%
[
7.5%
-
8.0%
]
7.98%
198,6842.2%
[
8.0%
-
8.5%
]
8.49%
84,1382.3%
[
8.5%
-
9.0%
]
8.86%
320,9223.2%
[
9.0%
-
9.5%
]
9.37%
30,3855.0%
[
9.5%
-
10.0%
]
9.63%
85,0132.5%
[
10.0%
-
10.5%
]
10.17%
52,2832.5%
[
10.0%
-
10.5%
]
10.42%
98,2072.7%
[
10.5%
-
11.0%
]
10.90%
127,9553.4%
[
11.0%
-
11.5%
]
11.30%
142,1264.1%
[
11.5%
-
12.0%
]
11.83%
46,9793.0%
[
12.0%
-
12.5%
]
12.14%
49,9952.3%
[
12.0%
-
12.5%
]
12.43%
22,4143.5%
[
13.5%
-
14.0%
]
13.53%
38,2222.6%
[
13.5%
-
14.0%
]
13.60%
72,8093.3%
[
14.0%
-
14.5%
]
14.24%
1,2153.6%
[
14.0%
-
14.5%
]
14.46%
3322.5%
[
15.0%
-
15.5%
]
15.38%
15611.5%
[
16.0%
-
16.5%
]
16.13%
34,0462.0%
[
16.5%
-
17.0%
]
16.52%
1,1325.1%
[
17.0%
-
17.5%
]
17.22%
25,3374.5%
[
17.0%
-
17.5%
]
17.50%
1206.4%
[
18.0%
-
18.5%
]
18.40%
8864.0%
[
19.0%
-
19.5%
]
19.02%
8,5511.3%
[
20.0%
-
20.5%
]
20.38%
2114.7%
[
20.5%
-
21.0%
]
20.62%
1603.9%
[
21.5%
-
22.0%
]
21.88%
968.1%
[
23.0%
-
23.5%
]
23.30%
43,2133.3%
[
27.5%
-
28.0%
]
27.95%
5084.5%
[
30.5%
-
31.0%
]
30.52%
27,8422.5%
[
31.5%
-
32.0%
]
32.00%
12,4051.4%
[
33.0%
-
33.5%
]
33.47%
62,4743.4%
[
34.0%
-
34.5%
]
34.38%
5,5264.1%
[
38.0%
-
38.5%
]
38.00%
1504.7%
[
44.0%
-
44.5%
]
44.01%
108,4142.5%
[
44.5%
-
45.0%
]
44.98%
40,3923.3%
[
47.5%
-
48.0%
]
47.71%
8,9192.4%
[
60.5%
-
61.0%
]
60.91%
6601.7%
[
64.0%
-
64.5%
]
64.10%
53,0443.1%