Arab Male Disability

COMPARE

Arab
Race
Ancestry
AfghanAfricanAlaska NativeAlaskan AthabascanAlbanianAleutAlsatianAmericanApacheArabArapahoArgentineanArmenianAssyrian/Chaldean/SyriacAustralianAustrianBahamianBangladeshiBarbadianBasqueBelgianBelizeanBermudanBhutaneseBlackfeetBolivianBrazilianBritishBritish West IndianBulgarianBurmeseCajunCambodianCanadianCape VerdeanCarpatho RusynCelticCentral AmericanCentral American IndianCherokeeCheyenneChickasawChileanChineseChippewaChoctawColombianColvilleComancheCosta RicanCreeCreekCroatianCrowCubanCypriotCzechCzechoslovakianDanishDelawareDominicanDutchDutch West IndianEastern EuropeanEcuadorianEgyptianEnglishEstonianEthiopianEuropeanFijianFilipinoFinnishFrenchFrench American IndianFrench CanadianGermanGerman RussianGhanaianGreekGuamanian/ChamorroGuatemalanGuyaneseHaitianHmongHonduranHopiHoumaHungarianIcelanderIndian (Asian)IndonesianInupiatIranianIraqiIrishIroquoisIsraeliItalianJamaicanJapaneseJordanianKenyanKiowaKoreanLaotianLatvianLebaneseLiberianLithuanianLumbeeLuxembourgerMacedonianMalaysianMalteseMarshalleseMenomineeMexicanMexican American IndianMongolianMoroccanNative HawaiianNavajoNepaleseNew ZealanderNicaraguanNigerianNorthern EuropeanNorwegianOkinawanOsageOttawaPaiutePakistaniPalestinianPanamanianParaguayanPennsylvania GermanPeruvianPimaPolishPortuguesePotawatomiPuebloPuerto RicanPuget Sound SalishRomanianRussianSalvadoranSamoanScandinavianScotch-IrishScottishSeminoleSenegaleseSerbianShoshoneSierra LeoneanSiouxSlavicSlovakSloveneSomaliSouth AfricanSouth AmericanSouth American IndianSoviet UnionSpaniardSpanishSpanish AmericanSpanish American IndianSri LankanSubsaharan AfricanSudaneseSwedishSwissSyrianTaiwaneseThaiTlingit-HaidaTohono O'OdhamTonganTrinidadian and TobagonianTsimshianTurkishU.S. Virgin IslanderUgandanUkrainianUruguayanUteVenezuelanVietnameseWelshWest IndianYakamaYaquiYugoslavianYumanYup'ikZimbabwean
Immigration
NonimmigrantsImmigrantsAfghanistanAfricaAlbaniaArgentinaArmeniaAsiaAustraliaAustriaBahamasBangladeshBarbadosBelarusBelgiumBelizeBoliviaBosnia and HerzegovinaBrazilBulgariaBurma/MyanmarCabo VerdeCambodiaCameroonCanadaCaribbeanCentral AmericaChileChinaColombiaCongoCosta RicaCroatiaCubaCzechoslovakiaDenmarkDominicaDominican RepublicEastern AfricaEastern AsiaEastern EuropeEcuadorEgyptEl SalvadorEnglandEritreaEthiopiaEuropeFijiFranceGermanyGhanaGreeceGrenadaGuatemalaGuyanaHaitiHondurasHong KongHungaryIndiaIndonesiaIranIraqIrelandIsraelItalyJamaicaJapanJordanKazakhstanKenyaKoreaKuwaitLaosLatin AmericaLatviaLebanonLiberiaLithuaniaMalaysiaMexicoMicronesiaMiddle AfricaMoldovaMoroccoNepalNetherlandsNicaraguaNigeriaNorth AmericaNorth MacedoniaNorthern AfricaNorthern EuropeNorwayOceaniaPakistanPanamaPeruPhilippinesPolandPortugalRomaniaRussiaSaudi ArabiaScotlandSenegalSerbiaSierra LeoneSingaporeSomaliaSouth AfricaSouth AmericaSouth Central AsiaSouth Eastern AsiaSouthern EuropeSpainSri LankaSt. Vincent and the GrenadinesSudanSwedenSwitzerlandSyriaTaiwanThailandTrinidad and TobagoTurkeyUgandaUkraineUruguayUzbekistanVenezuelaVietnamWest IndiesWestern AfricaWestern AsiaWestern EuropeYemenZaireZimbabweAzores
Select to Compare
Race
Ancestry
AfghanAfricanAlaska NativeAlaskan AthabascanAlbanianAleutAlsatianAmericanApacheArapahoArgentineanArmenianAssyrian/Chaldean/SyriacAustralianAustrianBahamianBangladeshiBarbadianBasqueBelgianBelizeanBermudanBhutaneseBlackfeetBolivianBrazilianBritishBritish West IndianBulgarianBurmeseCajunCambodianCanadianCape VerdeanCarpatho RusynCelticCentral AmericanCentral American IndianCherokeeCheyenneChickasawChileanChineseChippewaChoctawColombianColvilleComancheCosta RicanCreeCreekCroatianCrowCubanCypriotCzechCzechoslovakianDanishDelawareDominicanDutchDutch West IndianEastern EuropeanEcuadorianEgyptianEnglishEstonianEthiopianEuropeanFijianFilipinoFinnishFrenchFrench American IndianFrench CanadianGermanGerman RussianGhanaianGreekGuamanian/ChamorroGuatemalanGuyaneseHaitianHmongHonduranHopiHoumaHungarianIcelanderIndian (Asian)IndonesianInupiatIranianIraqiIrishIroquoisIsraeliItalianJamaicanJapaneseJordanianKenyanKiowaKoreanLaotianLatvianLebaneseLiberianLithuanianLumbeeLuxembourgerMacedonianMalaysianMalteseMarshalleseMenomineeMexicanMexican American IndianMongolianMoroccanNative HawaiianNavajoNepaleseNew ZealanderNicaraguanNigerianNorthern EuropeanNorwegianOkinawanOsageOttawaPaiutePakistaniPalestinianPanamanianParaguayanPennsylvania GermanPeruvianPimaPolishPortuguesePotawatomiPuebloPuerto RicanPuget Sound SalishRomanianRussianSalvadoranSamoanScandinavianScotch-IrishScottishSeminoleSenegaleseSerbianShoshoneSierra LeoneanSiouxSlavicSlovakSloveneSomaliSouth AfricanSouth AmericanSouth American IndianSoviet UnionSpaniardSpanishSpanish AmericanSpanish American IndianSri LankanSubsaharan AfricanSudaneseSwedishSwissSyrianTaiwaneseThaiTlingit-HaidaTohono O'OdhamTonganTrinidadian and TobagonianTsimshianTurkishU.S. Virgin IslanderUgandanUkrainianUruguayanUteVenezuelanVietnameseWelshWest IndianYakamaYaquiYugoslavianYumanYup'ikZimbabwean
Immigration
NonimmigrantsImmigrantsAfghanistanAfricaAlbaniaArgentinaArmeniaAsiaAustraliaAustriaBahamasBangladeshBarbadosBelarusBelgiumBelizeBoliviaBosnia and HerzegovinaBrazilBulgariaBurma/MyanmarCabo VerdeCambodiaCameroonCanadaCaribbeanCentral AmericaChileChinaColombiaCongoCosta RicaCroatiaCubaCzechoslovakiaDenmarkDominicaDominican RepublicEastern AfricaEastern AsiaEastern EuropeEcuadorEgyptEl SalvadorEnglandEritreaEthiopiaEuropeFijiFranceGermanyGhanaGreeceGrenadaGuatemalaGuyanaHaitiHondurasHong KongHungaryIndiaIndonesiaIranIraqIrelandIsraelItalyJamaicaJapanJordanKazakhstanKenyaKoreaKuwaitLaosLatin AmericaLatviaLebanonLiberiaLithuaniaMalaysiaMexicoMicronesiaMiddle AfricaMoldovaMoroccoNepalNetherlandsNicaraguaNigeriaNorth AmericaNorth MacedoniaNorthern AfricaNorthern EuropeNorwayOceaniaPakistanPanamaPeruPhilippinesPolandPortugalRomaniaRussiaSaudi ArabiaScotlandSenegalSerbiaSierra LeoneSingaporeSomaliaSouth AfricaSouth AmericaSouth Central AsiaSouth Eastern AsiaSouthern EuropeSpainSri LankaSt. Vincent and the GrenadinesSudanSwedenSwitzerlandSyriaTaiwanThailandTrinidad and TobagoTurkeyUgandaUkraineUruguayUzbekistanVenezuelaVietnamWest IndiesWestern AfricaWestern AsiaWestern EuropeYemenZaireZimbabweAzores
Male Disability
Income
Poverty
Unemployment
Labor Participation
Family Structure
Vehicle Availability
Education Level
Disability

Arab Male Disability
Excellent

11.0%
DISABILITY | MALES
81.5/ 100
METRIC RATING
141st/ 347
METRIC RANK

Arab Male Disability Correlation Chart

The statistical analysis conducted on geographies consisting of 486,768,170 people shows a moderate positive correlation between the proportion of Arabs and percentage of males with a disability in the United States with a correlation coefficient (R) of 0.489 and weighted average of 11.0%. On average, for every 1% (one percent) increase in Arabs within a typical geography, there is an increase of 0.36% in percentage of males with a disability.
Arab Male Disability
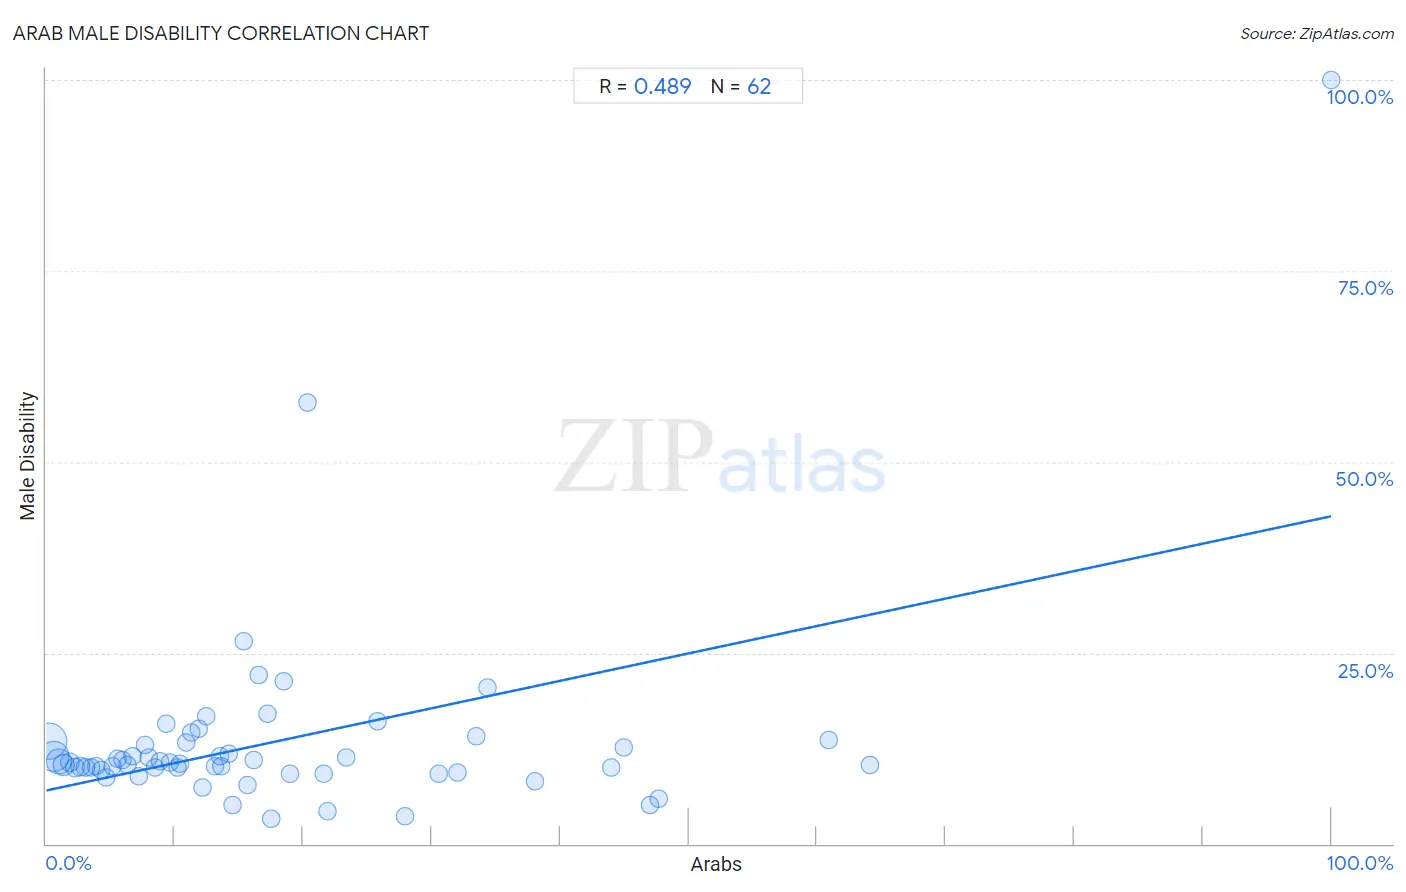
It is essential to understand that the correlation between the percentage of Arabs and percentage of males with a disability does not imply a direct cause-and-effect relationship. It remains uncertain whether the presence of Arabs influences an upward or downward trend in the level of percentage of males with a disability within an area, or if Arabs simply ended up residing in those areas with higher or lower levels of percentage of males with a disability due to other factors.

Demographics Similar to Arabs by Male Disability

In terms of male disability, the demographic groups most similar to Arabs are Immigrants from Italy (11.0%, a difference of 0.0%), Immigrants from Sudan (11.0%, a difference of 0.0%), South African (11.0%, a difference of 0.020%), Nigerian (11.0%, a difference of 0.040%), and Immigrants from Europe (11.0%, a difference of 0.050%).
DemographicsRating | RankMale Disability
Bhutanese
83.4
/100
|
#134
Excellent
11.0%
Trinidadians and Tobagonians
83.3
/100
|
#135
Excellent
11.0%
Immigrants from Costa Rica
82.8
/100
|
#136
Excellent
11.0%
Immigrants from Europe
82.0
/100
|
#137
Excellent
11.0%
Nigerians
81.9
/100
|
#138
Excellent
11.0%
South Africans
81.7
/100
|
#139
Excellent
11.0%
Immigrants from Italy
81.5
/100
|
#140
Excellent
11.0%
Arabs
81.5
/100
|
#141
Excellent
11.0%
Immigrants from Sudan
81.5
/100
|
#142
Excellent
11.0%
Moroccans
80.7
/100
|
#143
Excellent
11.0%
Kenyans
78.1
/100
|
#144
Good
11.0%
Costa Ricans
78.0
/100
|
#145
Good
11.0%
Koreans
77.5
/100
|
#146
Good
11.0%
Immigrants from Croatia
77.3
/100
|
#147
Good
11.0%
Sudanese
77.1
/100
|
#148
Good
11.0%

Arab Male Disability Correlation Summary

MeasurementArab DataMale Disability Data
Minimum0.20%3.3%
Maximum100.0%100.0%
Range99.8%96.7%
Mean18.1%13.5%
Median12.8%10.5%
Interquartile 25% (IQ1)6.3%9.6%
Interquartile 75% (IQ3)21.9%13.2%
Interquartile Range (IQR)15.6%3.6%
Standard Deviation (Sample)18.1%13.3%
Standard Deviation (Population)18.0%13.2%

Correlation Details

Arab PercentileSample SizeMale Disability
[
0.0%
-
0.5%
]
0.20%
197,348,36813.4%
[
0.5%
-
1.0%
]
0.61%
128,244,92811.5%
[
0.5%
-
1.0%
]
1.00%
74,007,72510.8%
[
1.0%
-
1.5%
]
1.39%
39,533,34610.3%
[
1.5%
-
2.0%
]
1.84%
15,945,24610.7%
[
2.0%
-
2.5%
]
2.24%
11,187,1829.9%
[
2.5%
-
3.0%
]
2.67%
6,887,59010.1%
[
3.0%
-
3.5%
]
3.06%
3,309,05210.0%
[
3.0%
-
3.5%
]
3.50%
2,100,58010.0%
[
3.5%
-
4.0%
]
3.87%
2,141,85310.1%
[
4.0%
-
4.5%
]
4.32%
940,4089.6%
[
4.5%
-
5.0%
]
4.71%
840,3798.7%
[
5.0%
-
5.5%
]
5.12%
681,74310.1%
[
5.5%
-
6.0%
]
5.54%
442,32211.1%
[
5.5%
-
6.0%
]
5.93%
219,86811.0%
[
6.0%
-
6.5%
]
6.31%
416,03410.4%
[
6.5%
-
7.0%
]
6.67%
282,88311.5%
[
7.0%
-
7.5%
]
7.24%
140,4978.8%
[
7.5%
-
8.0%
]
7.64%
282,10012.9%
[
7.5%
-
8.0%
]
7.98%
198,68411.3%
[
8.0%
-
8.5%
]
8.49%
84,44310.0%
[
8.5%
-
9.0%
]
8.86%
322,62310.8%
[
9.0%
-
9.5%
]
9.37%
30,38515.8%
[
9.5%
-
10.0%
]
9.62%
86,22210.7%
[
10.0%
-
10.5%
]
10.17%
53,47210.0%
[
10.0%
-
10.5%
]
10.42%
98,20710.4%
[
10.5%
-
11.0%
]
10.90%
127,95513.2%
[
11.0%
-
11.5%
]
11.30%
145,54414.6%
[
11.5%
-
12.0%
]
11.83%
46,97915.0%
[
12.0%
-
12.5%
]
12.14%
51,4717.3%
[
12.0%
-
12.5%
]
12.43%
22,41416.7%
[
13.0%
-
13.5%
]
13.11%
12210.2%
[
13.5%
-
14.0%
]
13.53%
38,22211.4%
[
13.5%
-
14.0%
]
13.60%
72,80910.1%
[
14.0%
-
14.5%
]
14.24%
1,21511.9%
[
14.0%
-
14.5%
]
14.46%
3325.1%
[
15.0%
-
15.5%
]
15.38%
15626.6%
[
15.5%
-
16.0%
]
15.65%
5757.7%
[
16.0%
-
16.5%
]
16.13%
34,04611.0%
[
16.5%
-
17.0%
]
16.52%
1,13222.0%
[
17.0%
-
17.5%
]
17.22%
25,33717.1%
[
17.0%
-
17.5%
]
17.50%
1203.3%
[
18.0%
-
18.5%
]
18.45%
64521.4%
[
19.0%
-
19.5%
]
19.02%
8,5519.2%
[
20.0%
-
20.5%
]
20.38%
21157.8%
[
21.5%
-
22.0%
]
21.57%
519.1%
[
21.5%
-
22.0%
]
21.88%
964.3%
[
23.0%
-
23.5%
]
23.30%
43,21311.3%
[
25.5%
-
26.0%
]
25.80%
31416.1%
[
27.5%
-
28.0%
]
27.95%
5083.6%
[
30.5%
-
31.0%
]
30.52%
27,8429.1%
[
31.5%
-
32.0%
]
32.00%
12,4059.3%
[
33.0%
-
33.5%
]
33.47%
62,47414.1%
[
34.0%
-
34.5%
]
34.38%
5,52620.5%
[
38.0%
-
38.5%
]
38.00%
1508.1%
[
44.0%
-
44.5%
]
44.01%
108,41410.0%
[
44.5%
-
45.0%
]
44.98%
40,39212.6%
[
47.0%
-
47.5%
]
47.01%
1175.0%
[
47.5%
-
48.0%
]
47.71%
8,9195.9%
[
60.5%
-
61.0%
]
60.91%
66013.6%
[
64.0%
-
64.5%
]
64.10%
53,04410.2%
[
99.5%
-
100.0%
]
100.00%
69100.0%