Arab Married-couple Households
COMPARE
Arab
Select to Compare
Married-couple Households
Arab Married-couple Households
46.9%
MARRIED-COUPLE HOUSEHOLDS
76.0/ 100
METRIC RATING
155th/ 347
METRIC RANK
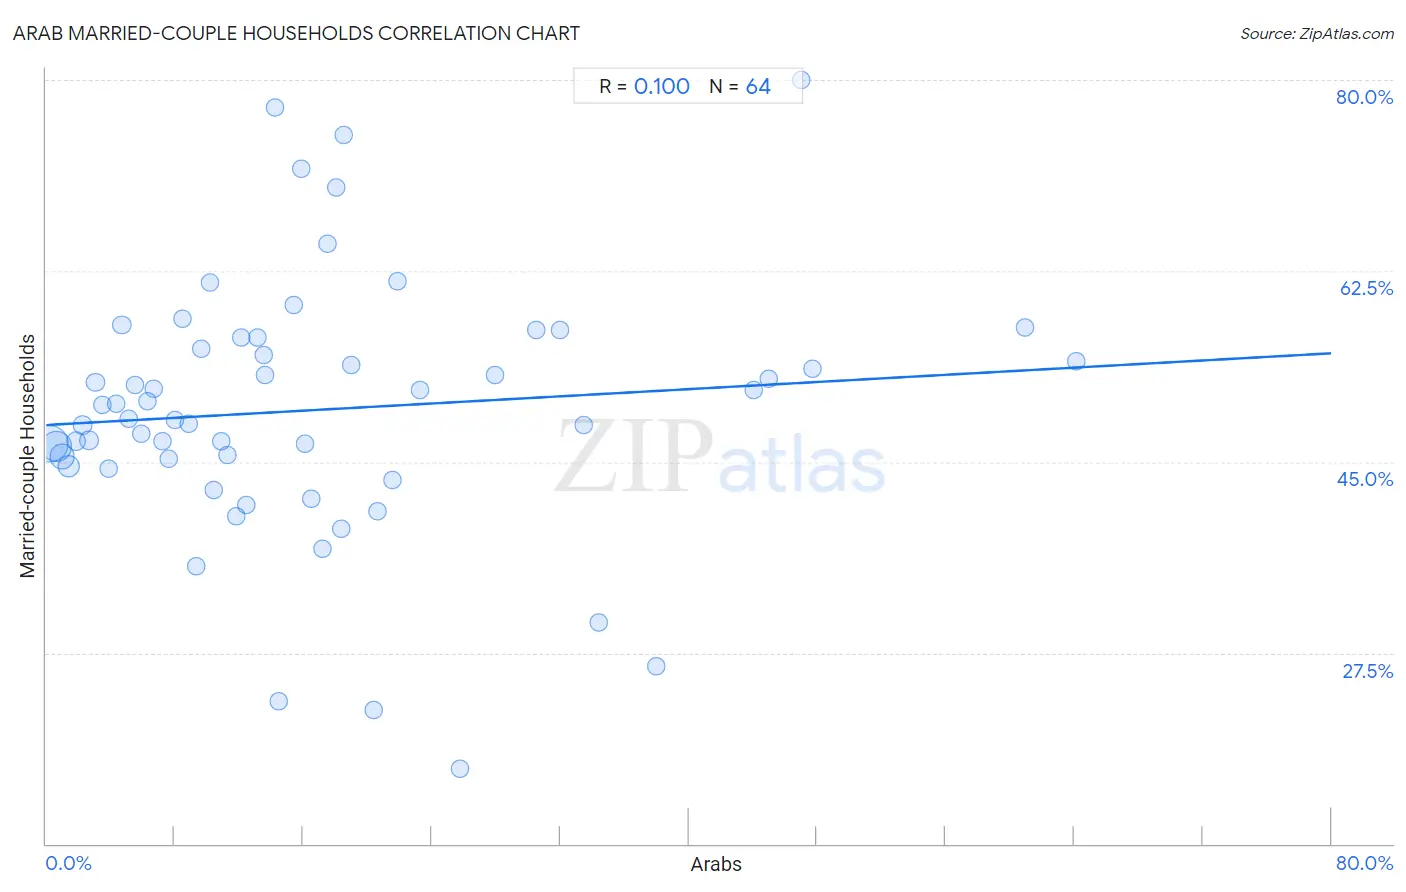
Arab Married-couple Households Correlation Chart
The statistical analysis conducted on geographies consisting of 486,357,143 people shows a slight positive correlation between the proportion of Arabs and percentage of married-couple family households in the United States with a correlation coefficient (R) of 0.100 and weighted average of 46.9%. On average, for every 1% (one percent) increase in Arabs within a typical geography, there is an increase of 0.082% in percentage of married-couple family households.
It is essential to understand that the correlation between the percentage of Arabs and percentage of married-couple family households does not imply a direct cause-and-effect relationship. It remains uncertain whether the presence of Arabs influences an upward or downward trend in the level of percentage of married-couple family households within an area, or if Arabs simply ended up residing in those areas with higher or lower levels of percentage of married-couple family households due to other factors.
Demographics Similar to Arabs by Married-couple Households
In terms of married-couple households, the demographic groups most similar to Arabs are Hmong (47.0%, a difference of 0.010%), Immigrants from Western Asia (46.9%, a difference of 0.010%), Serbian (47.0%, a difference of 0.020%), Armenian (46.9%, a difference of 0.030%), and Immigrants from Bulgaria (47.0%, a difference of 0.040%).
| Demographics | Rating | Rank | Married-couple Households |
| Icelanders | 79.5 /100 | #148 | Good 47.0% |
| Paraguayans | 78.7 /100 | #149 | Good 47.0% |
| Immigrants from Russia | 77.6 /100 | #150 | Good 47.0% |
| Immigrants from Bulgaria | 76.8 /100 | #151 | Good 47.0% |
| Serbians | 76.3 /100 | #152 | Good 47.0% |
| Hmong | 76.2 /100 | #153 | Good 47.0% |
| Immigrants from Western Asia | 76.1 /100 | #154 | Good 46.9% |
| Arabs | 76.0 /100 | #155 | Good 46.9% |
| Armenians | 75.4 /100 | #156 | Good 46.9% |
| Immigrants from Oceania | 74.8 /100 | #157 | Good 46.9% |
| Nonimmigrants | 73.3 /100 | #158 | Good 46.9% |
| Osage | 73.2 /100 | #159 | Good 46.9% |
| Iraqis | 71.7 /100 | #160 | Good 46.9% |
| Delaware | 71.2 /100 | #161 | Good 46.8% |
| Colombians | 71.0 /100 | #162 | Good 46.8% |
Arab Married-couple Households Correlation Summary
| Measurement | Arab Data | Married-couple Households Data |
| Minimum | 0.20% | 16.8% |
| Maximum | 64.1% | 80.0% |
| Range | 63.9% | 63.2% |
| Mean | 16.8% | 49.8% |
| Median | 13.3% | 49.6% |
| Interquartile 25% (IQ1) | 6.5% | 45.0% |
| Interquartile 75% (IQ3) | 21.1% | 55.9% |
| Interquartile Range (IQR) | 14.6% | 11.0% |
| Standard Deviation (Sample) | 14.5% | 11.9% |
| Standard Deviation (Population) | 14.4% | 11.8% |
Correlation Details
| Arab Percentile | Sample Size | Married-couple Households |
[ 0.0% - 0.5% ] 0.20% | 197,232,465 | 46.7% |
[ 0.5% - 1.0% ] 0.61% | 128,140,034 | 46.4% |
[ 0.5% - 1.0% ] 1.00% | 73,912,217 | 45.5% |
[ 1.0% - 1.5% ] 1.39% | 39,493,116 | 44.6% |
[ 1.5% - 2.0% ] 1.84% | 15,917,448 | 46.9% |
[ 2.0% - 2.5% ] 2.24% | 11,169,887 | 48.3% |
[ 2.5% - 3.0% ] 2.67% | 6,874,366 | 47.0% |
[ 3.0% - 3.5% ] 3.06% | 3,306,681 | 52.3% |
[ 3.0% - 3.5% ] 3.50% | 2,101,274 | 50.2% |
[ 3.5% - 4.0% ] 3.87% | 2,141,312 | 44.4% |
[ 4.0% - 4.5% ] 4.32% | 940,941 | 50.4% |
[ 4.5% - 5.0% ] 4.71% | 840,728 | 57.6% |
[ 5.0% - 5.5% ] 5.12% | 681,743 | 49.0% |
[ 5.5% - 6.0% ] 5.54% | 442,778 | 52.0% |
[ 5.5% - 6.0% ] 5.93% | 219,868 | 47.6% |
[ 6.0% - 6.5% ] 6.31% | 415,222 | 50.6% |
[ 6.5% - 7.0% ] 6.67% | 283,117 | 51.7% |
[ 7.0% - 7.5% ] 7.24% | 141,035 | 46.9% |
[ 7.5% - 8.0% ] 7.64% | 282,500 | 45.3% |
[ 7.5% - 8.0% ] 7.98% | 199,092 | 48.8% |
[ 8.0% - 8.5% ] 8.49% | 84,443 | 58.1% |
[ 8.5% - 9.0% ] 8.86% | 322,956 | 48.5% |
[ 9.0% - 9.5% ] 9.36% | 30,824 | 35.5% |
[ 9.5% - 10.0% ] 9.63% | 86,980 | 55.4% |
[ 10.0% - 10.5% ] 10.17% | 53,472 | 61.4% |
[ 10.0% - 10.5% ] 10.42% | 98,207 | 42.4% |
[ 10.5% - 11.0% ] 10.90% | 127,955 | 46.9% |
[ 11.0% - 11.5% ] 11.30% | 145,544 | 45.7% |
[ 11.5% - 12.0% ] 11.83% | 47,371 | 40.0% |
[ 12.0% - 12.5% ] 12.14% | 51,471 | 56.5% |
[ 12.0% - 12.5% ] 12.43% | 22,082 | 41.1% |
[ 13.0% - 13.5% ] 13.11% | 122 | 56.4% |
[ 13.5% - 14.0% ] 13.53% | 38,222 | 54.8% |
[ 13.5% - 14.0% ] 13.60% | 72,809 | 53.0% |
[ 14.0% - 14.5% ] 14.24% | 1,215 | 77.5% |
[ 14.0% - 14.5% ] 14.46% | 332 | 23.0% |
[ 15.0% - 15.5% ] 15.38% | 156 | 59.4% |
[ 15.5% - 16.0% ] 15.87% | 2,042 | 71.9% |
[ 16.0% - 16.5% ] 16.13% | 34,046 | 46.7% |
[ 16.5% - 17.0% ] 16.52% | 1,132 | 41.6% |
[ 17.0% - 17.5% ] 17.22% | 25,511 | 37.0% |
[ 17.0% - 17.5% ] 17.50% | 120 | 65.0% |
[ 18.0% - 18.5% ] 18.09% | 94 | 70.2% |
[ 18.0% - 18.5% ] 18.38% | 952 | 38.9% |
[ 18.5% - 19.0% ] 18.52% | 54 | 75.0% |
[ 19.0% - 19.5% ] 19.02% | 8,551 | 53.9% |
[ 20.0% - 20.5% ] 20.38% | 211 | 22.2% |
[ 20.5% - 21.0% ] 20.62% | 160 | 40.4% |
[ 21.5% - 22.0% ] 21.57% | 51 | 43.3% |
[ 21.5% - 22.0% ] 21.88% | 96 | 61.5% |
[ 23.0% - 23.5% ] 23.30% | 43,213 | 51.6% |
[ 25.5% - 26.0% ] 25.80% | 314 | 16.8% |
[ 27.5% - 28.0% ] 27.93% | 598 | 52.9% |
[ 30.5% - 31.0% ] 30.52% | 27,894 | 57.1% |
[ 31.5% - 32.0% ] 32.00% | 12,405 | 57.1% |
[ 33.0% - 33.5% ] 33.47% | 62,492 | 48.4% |
[ 34.0% - 34.5% ] 34.38% | 5,526 | 30.3% |
[ 38.0% - 38.5% ] 38.00% | 150 | 26.3% |
[ 44.0% - 44.5% ] 44.01% | 108,414 | 51.6% |
[ 44.5% - 45.0% ] 44.98% | 40,392 | 52.7% |
[ 47.0% - 47.5% ] 47.01% | 117 | 80.0% |
[ 47.5% - 48.0% ] 47.71% | 8,919 | 53.6% |
[ 60.5% - 61.0% ] 60.91% | 660 | 57.3% |
[ 64.0% - 64.5% ] 64.10% | 53,044 | 54.2% |