Arab College, 1 year or more
COMPARE
Arab
Select to Compare
College, 1 year or more
Arab College, 1 year or more
61.6%
COLLEGE, 1 YEAR OR MORE
93.9/ 100
METRIC RATING
117th/ 347
METRIC RANK
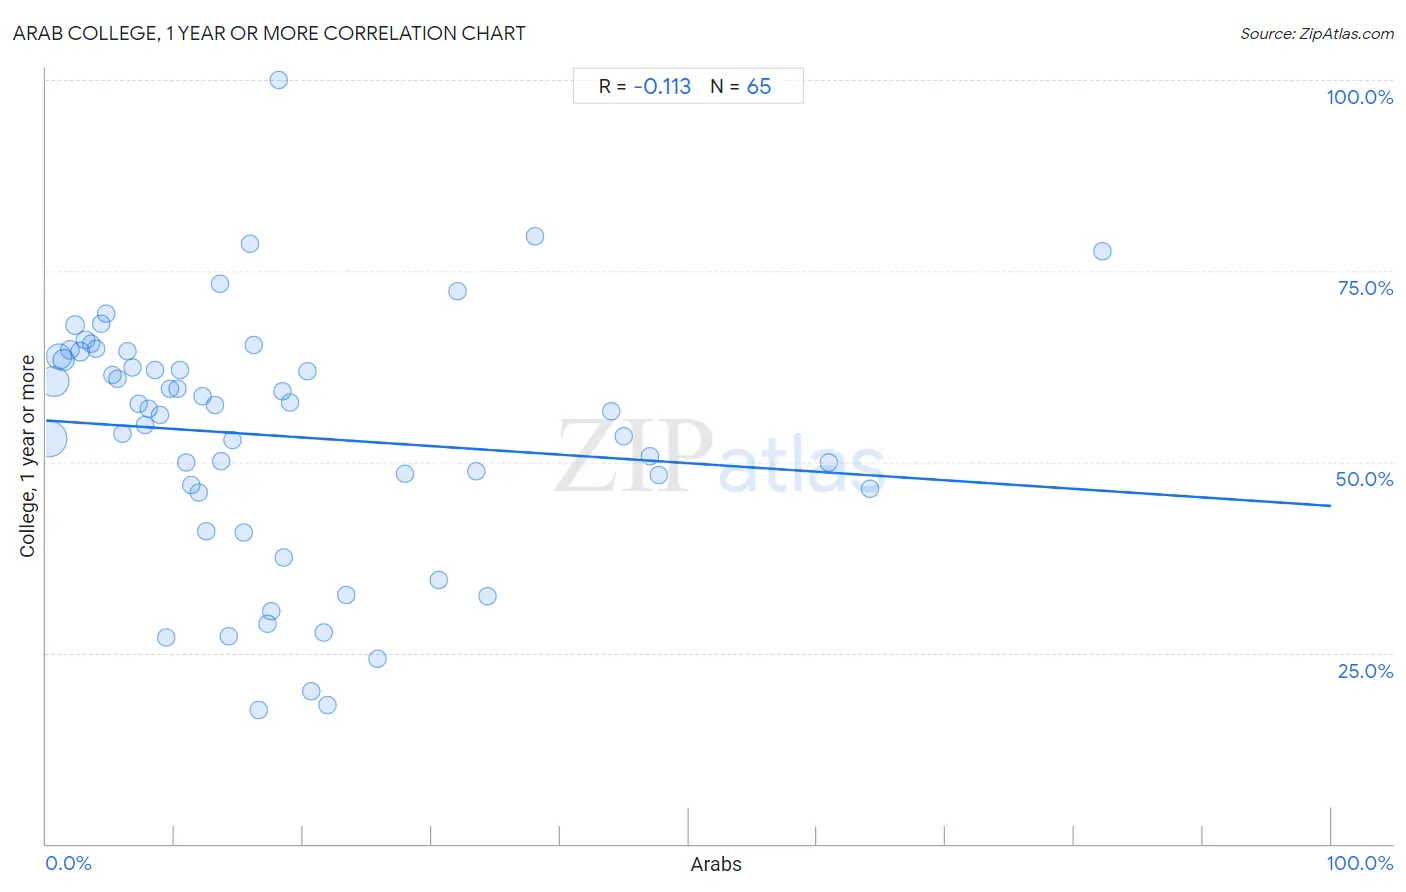
Arab College, 1 year or more Correlation Chart
The statistical analysis conducted on geographies consisting of 486,868,588 people shows a poor negative correlation between the proportion of Arabs and percentage of population with at least college, 1 year or more education in the United States with a correlation coefficient (R) of -0.113 and weighted average of 61.6%. On average, for every 1% (one percent) increase in Arabs within a typical geography, there is a decrease of 0.11% in percentage of population with at least college, 1 year or more education.
It is essential to understand that the correlation between the percentage of Arabs and percentage of population with at least college, 1 year or more education does not imply a direct cause-and-effect relationship. It remains uncertain whether the presence of Arabs influences an upward or downward trend in the level of percentage of population with at least college, 1 year or more education within an area, or if Arabs simply ended up residing in those areas with higher or lower levels of percentage of population with at least college, 1 year or more education due to other factors.
Demographics Similar to Arabs by College, 1 year or more
In terms of college, 1 year or more, the demographic groups most similar to Arabs are Immigrants from Brazil (61.6%, a difference of 0.0%), Lebanese (61.6%, a difference of 0.040%), Norwegian (61.7%, a difference of 0.14%), Assyrian/Chaldean/Syriac (61.5%, a difference of 0.14%), and Pakistani (61.5%, a difference of 0.14%).
| Demographics | Rating | Rank | College, 1 year or more |
| Europeans | 95.6 /100 | #110 | Exceptional 61.8% |
| Macedonians | 95.6 /100 | #111 | Exceptional 61.8% |
| Austrians | 95.4 /100 | #112 | Exceptional 61.8% |
| Ukrainians | 95.2 /100 | #113 | Exceptional 61.8% |
| Danes | 94.8 /100 | #114 | Exceptional 61.7% |
| Norwegians | 94.5 /100 | #115 | Exceptional 61.7% |
| Lebanese | 94.1 /100 | #116 | Exceptional 61.6% |
| Arabs | 93.9 /100 | #117 | Exceptional 61.6% |
| Immigrants from Brazil | 93.9 /100 | #118 | Exceptional 61.6% |
| Assyrians/Chaldeans/Syriacs | 93.3 /100 | #119 | Exceptional 61.5% |
| Pakistanis | 93.2 /100 | #120 | Exceptional 61.5% |
| Immigrants from Jordan | 92.7 /100 | #121 | Exceptional 61.4% |
| Immigrants from Chile | 92.3 /100 | #122 | Exceptional 61.4% |
| Serbians | 92.2 /100 | #123 | Exceptional 61.4% |
| Venezuelans | 92.1 /100 | #124 | Exceptional 61.3% |
Arab College, 1 year or more Correlation Summary
| Measurement | Arab Data | College, 1 year or more Data |
| Minimum | 0.20% | 17.6% |
| Maximum | 82.2% | 100.0% |
| Range | 82.0% | 82.4% |
| Mean | 17.8% | 53.4% |
| Median | 13.5% | 57.0% |
| Interquartile 25% (IQ1) | 6.5% | 46.2% |
| Interquartile 75% (IQ3) | 21.7% | 64.1% |
| Interquartile Range (IQR) | 15.2% | 17.9% |
| Standard Deviation (Sample) | 16.5% | 16.3% |
| Standard Deviation (Population) | 16.4% | 16.2% |
Correlation Details
| Arab Percentile | Sample Size | College, 1 year or more |
[ 0.0% - 0.5% ] 0.20% | 197,409,105 | 53.1% |
[ 0.5% - 1.0% ] 0.61% | 128,265,035 | 60.5% |
[ 0.5% - 1.0% ] 1.00% | 74,009,936 | 63.8% |
[ 1.0% - 1.5% ] 1.39% | 39,533,185 | 63.3% |
[ 1.5% - 2.0% ] 1.84% | 15,949,580 | 64.6% |
[ 2.0% - 2.5% ] 2.24% | 11,190,613 | 68.0% |
[ 2.5% - 3.0% ] 2.67% | 6,888,008 | 64.4% |
[ 3.0% - 3.5% ] 3.06% | 3,308,490 | 66.0% |
[ 3.0% - 3.5% ] 3.50% | 2,103,282 | 65.5% |
[ 3.5% - 4.0% ] 3.87% | 2,142,218 | 64.9% |
[ 4.0% - 4.5% ] 4.32% | 940,941 | 68.0% |
[ 4.5% - 5.0% ] 4.71% | 840,728 | 69.5% |
[ 5.0% - 5.5% ] 5.12% | 681,743 | 61.3% |
[ 5.5% - 6.0% ] 5.54% | 442,981 | 60.8% |
[ 5.5% - 6.0% ] 5.93% | 219,868 | 53.7% |
[ 6.0% - 6.5% ] 6.31% | 415,222 | 64.5% |
[ 6.5% - 7.0% ] 6.67% | 283,117 | 62.4% |
[ 7.0% - 7.5% ] 7.24% | 141,035 | 57.6% |
[ 7.5% - 8.0% ] 7.64% | 282,500 | 54.8% |
[ 7.5% - 8.0% ] 7.98% | 199,092 | 57.0% |
[ 8.0% - 8.5% ] 8.49% | 84,443 | 62.0% |
[ 8.5% - 9.0% ] 8.86% | 323,125 | 56.2% |
[ 9.0% - 9.5% ] 9.36% | 30,824 | 27.0% |
[ 9.5% - 10.0% ] 9.63% | 86,980 | 59.5% |
[ 10.0% - 10.5% ] 10.17% | 53,472 | 59.6% |
[ 10.0% - 10.5% ] 10.42% | 98,207 | 62.0% |
[ 10.5% - 11.0% ] 10.90% | 127,955 | 50.0% |
[ 11.0% - 11.5% ] 11.30% | 145,544 | 46.9% |
[ 11.5% - 12.0% ] 11.83% | 47,371 | 46.0% |
[ 12.0% - 12.5% ] 12.14% | 51,471 | 58.6% |
[ 12.0% - 12.5% ] 12.43% | 22,414 | 41.0% |
[ 13.0% - 13.5% ] 13.11% | 122 | 57.4% |
[ 13.5% - 14.0% ] 13.53% | 38,222 | 73.3% |
[ 13.5% - 14.0% ] 13.60% | 72,809 | 50.1% |
[ 14.0% - 14.5% ] 14.24% | 1,215 | 27.2% |
[ 14.0% - 14.5% ] 14.46% | 332 | 52.9% |
[ 15.0% - 15.5% ] 15.38% | 156 | 40.8% |
[ 15.5% - 16.0% ] 15.87% | 2,042 | 78.5% |
[ 16.0% - 16.5% ] 16.13% | 34,046 | 65.3% |
[ 16.5% - 17.0% ] 16.52% | 1,132 | 17.6% |
[ 17.0% - 17.5% ] 17.22% | 25,511 | 28.8% |
[ 17.0% - 17.5% ] 17.50% | 120 | 30.4% |
[ 18.0% - 18.5% ] 18.09% | 94 | 100.0% |
[ 18.0% - 18.5% ] 18.38% | 952 | 59.2% |
[ 18.5% - 19.0% ] 18.52% | 54 | 37.5% |
[ 19.0% - 19.5% ] 19.02% | 8,551 | 57.7% |
[ 20.0% - 20.5% ] 20.38% | 211 | 61.8% |
[ 20.5% - 21.0% ] 20.62% | 160 | 20.0% |
[ 21.5% - 22.0% ] 21.57% | 51 | 27.7% |
[ 21.5% - 22.0% ] 21.88% | 96 | 18.2% |
[ 23.0% - 23.5% ] 23.30% | 43,213 | 32.6% |
[ 25.5% - 26.0% ] 25.80% | 314 | 24.2% |
[ 27.5% - 28.0% ] 27.93% | 598 | 48.4% |
[ 30.5% - 31.0% ] 30.52% | 27,894 | 34.5% |
[ 31.5% - 32.0% ] 32.00% | 12,405 | 72.4% |
[ 33.0% - 33.5% ] 33.47% | 62,474 | 48.8% |
[ 34.0% - 34.5% ] 34.38% | 5,526 | 32.5% |
[ 38.0% - 38.5% ] 38.00% | 150 | 79.5% |
[ 44.0% - 44.5% ] 44.01% | 108,414 | 56.6% |
[ 44.5% - 45.0% ] 44.98% | 40,392 | 53.3% |
[ 47.0% - 47.5% ] 47.01% | 117 | 50.7% |
[ 47.5% - 48.0% ] 47.71% | 8,919 | 48.3% |
[ 60.5% - 61.0% ] 60.91% | 660 | 50.0% |
[ 64.0% - 64.5% ] 64.10% | 53,044 | 46.4% |
[ 82.0% - 82.5% ] 82.24% | 107 | 77.6% |