Arab 4 or more Vehicles in Household

COMPARE

Arab
Race
Ancestry
AfghanAfricanAlaska NativeAlaskan AthabascanAlbanianAleutAlsatianAmericanApacheArabArapahoArgentineanArmenianAssyrian/Chaldean/SyriacAustralianAustrianBahamianBangladeshiBarbadianBasqueBelgianBelizeanBermudanBhutaneseBlackfeetBolivianBrazilianBritishBritish West IndianBulgarianBurmeseCajunCambodianCanadianCape VerdeanCarpatho RusynCelticCentral AmericanCentral American IndianCherokeeCheyenneChickasawChileanChineseChippewaChoctawColombianColvilleComancheCosta RicanCreeCreekCroatianCrowCubanCypriotCzechCzechoslovakianDanishDelawareDominicanDutchDutch West IndianEastern EuropeanEcuadorianEgyptianEnglishEstonianEthiopianEuropeanFijianFilipinoFinnishFrenchFrench American IndianFrench CanadianGermanGerman RussianGhanaianGreekGuamanian/ChamorroGuatemalanGuyaneseHaitianHmongHonduranHopiHoumaHungarianIcelanderIndian (Asian)IndonesianInupiatIranianIraqiIrishIroquoisIsraeliItalianJamaicanJapaneseJordanianKenyanKiowaKoreanLaotianLatvianLebaneseLiberianLithuanianLumbeeLuxembourgerMacedonianMalaysianMalteseMarshalleseMenomineeMexicanMexican American IndianMongolianMoroccanNative HawaiianNavajoNepaleseNew ZealanderNicaraguanNigerianNorthern EuropeanNorwegianOkinawanOsageOttawaPaiutePakistaniPalestinianPanamanianParaguayanPennsylvania GermanPeruvianPimaPolishPortuguesePotawatomiPuebloPuerto RicanPuget Sound SalishRomanianRussianSalvadoranSamoanScandinavianScotch-IrishScottishSeminoleSenegaleseSerbianShoshoneSierra LeoneanSiouxSlavicSlovakSloveneSomaliSouth AfricanSouth AmericanSouth American IndianSoviet UnionSpaniardSpanishSpanish AmericanSpanish American IndianSri LankanSubsaharan AfricanSudaneseSwedishSwissSyrianTaiwaneseThaiTlingit-HaidaTohono O'OdhamTonganTrinidadian and TobagonianTsimshianTurkishU.S. Virgin IslanderUgandanUkrainianUruguayanUteVenezuelanVietnameseWelshWest IndianYakamaYaquiYugoslavianYumanYup'ikZimbabwean
Immigration
NonimmigrantsImmigrantsAfghanistanAfricaAlbaniaArgentinaArmeniaAsiaAustraliaAustriaBahamasBangladeshBarbadosBelarusBelgiumBelizeBoliviaBosnia and HerzegovinaBrazilBulgariaBurma/MyanmarCabo VerdeCambodiaCameroonCanadaCaribbeanCentral AmericaChileChinaColombiaCongoCosta RicaCroatiaCubaCzechoslovakiaDenmarkDominicaDominican RepublicEastern AfricaEastern AsiaEastern EuropeEcuadorEgyptEl SalvadorEnglandEritreaEthiopiaEuropeFijiFranceGermanyGhanaGreeceGrenadaGuatemalaGuyanaHaitiHondurasHong KongHungaryIndiaIndonesiaIranIraqIrelandIsraelItalyJamaicaJapanJordanKazakhstanKenyaKoreaKuwaitLaosLatin AmericaLatviaLebanonLiberiaLithuaniaMalaysiaMexicoMicronesiaMiddle AfricaMoldovaMoroccoNepalNetherlandsNicaraguaNigeriaNorth AmericaNorth MacedoniaNorthern AfricaNorthern EuropeNorwayOceaniaPakistanPanamaPeruPhilippinesPolandPortugalRomaniaRussiaSaudi ArabiaScotlandSenegalSerbiaSierra LeoneSingaporeSomaliaSouth AfricaSouth AmericaSouth Central AsiaSouth Eastern AsiaSouthern EuropeSpainSri LankaSt. Vincent and the GrenadinesSudanSwedenSwitzerlandSyriaTaiwanThailandTrinidad and TobagoTurkeyUgandaUkraineUruguayUzbekistanVenezuelaVietnamWest IndiesWestern AfricaWestern AsiaWestern EuropeYemenZaireZimbabweAzores
Select to Compare
Race
Ancestry
AfghanAfricanAlaska NativeAlaskan AthabascanAlbanianAleutAlsatianAmericanApacheArapahoArgentineanArmenianAssyrian/Chaldean/SyriacAustralianAustrianBahamianBangladeshiBarbadianBasqueBelgianBelizeanBermudanBhutaneseBlackfeetBolivianBrazilianBritishBritish West IndianBulgarianBurmeseCajunCambodianCanadianCape VerdeanCarpatho RusynCelticCentral AmericanCentral American IndianCherokeeCheyenneChickasawChileanChineseChippewaChoctawColombianColvilleComancheCosta RicanCreeCreekCroatianCrowCubanCypriotCzechCzechoslovakianDanishDelawareDominicanDutchDutch West IndianEastern EuropeanEcuadorianEgyptianEnglishEstonianEthiopianEuropeanFijianFilipinoFinnishFrenchFrench American IndianFrench CanadianGermanGerman RussianGhanaianGreekGuamanian/ChamorroGuatemalanGuyaneseHaitianHmongHonduranHopiHoumaHungarianIcelanderIndian (Asian)IndonesianInupiatIranianIraqiIrishIroquoisIsraeliItalianJamaicanJapaneseJordanianKenyanKiowaKoreanLaotianLatvianLebaneseLiberianLithuanianLumbeeLuxembourgerMacedonianMalaysianMalteseMarshalleseMenomineeMexicanMexican American IndianMongolianMoroccanNative HawaiianNavajoNepaleseNew ZealanderNicaraguanNigerianNorthern EuropeanNorwegianOkinawanOsageOttawaPaiutePakistaniPalestinianPanamanianParaguayanPennsylvania GermanPeruvianPimaPolishPortuguesePotawatomiPuebloPuerto RicanPuget Sound SalishRomanianRussianSalvadoranSamoanScandinavianScotch-IrishScottishSeminoleSenegaleseSerbianShoshoneSierra LeoneanSiouxSlavicSlovakSloveneSomaliSouth AfricanSouth AmericanSouth American IndianSoviet UnionSpaniardSpanishSpanish AmericanSpanish American IndianSri LankanSubsaharan AfricanSudaneseSwedishSwissSyrianTaiwaneseThaiTlingit-HaidaTohono O'OdhamTonganTrinidadian and TobagonianTsimshianTurkishU.S. Virgin IslanderUgandanUkrainianUruguayanUteVenezuelanVietnameseWelshWest IndianYakamaYaquiYugoslavianYumanYup'ikZimbabwean
Immigration
NonimmigrantsImmigrantsAfghanistanAfricaAlbaniaArgentinaArmeniaAsiaAustraliaAustriaBahamasBangladeshBarbadosBelarusBelgiumBelizeBoliviaBosnia and HerzegovinaBrazilBulgariaBurma/MyanmarCabo VerdeCambodiaCameroonCanadaCaribbeanCentral AmericaChileChinaColombiaCongoCosta RicaCroatiaCubaCzechoslovakiaDenmarkDominicaDominican RepublicEastern AfricaEastern AsiaEastern EuropeEcuadorEgyptEl SalvadorEnglandEritreaEthiopiaEuropeFijiFranceGermanyGhanaGreeceGrenadaGuatemalaGuyanaHaitiHondurasHong KongHungaryIndiaIndonesiaIranIraqIrelandIsraelItalyJamaicaJapanJordanKazakhstanKenyaKoreaKuwaitLaosLatin AmericaLatviaLebanonLiberiaLithuaniaMalaysiaMexicoMicronesiaMiddle AfricaMoldovaMoroccoNepalNetherlandsNicaraguaNigeriaNorth AmericaNorth MacedoniaNorthern AfricaNorthern EuropeNorwayOceaniaPakistanPanamaPeruPhilippinesPolandPortugalRomaniaRussiaSaudi ArabiaScotlandSenegalSerbiaSierra LeoneSingaporeSomaliaSouth AfricaSouth AmericaSouth Central AsiaSouth Eastern AsiaSouthern EuropeSpainSri LankaSt. Vincent and the GrenadinesSudanSwedenSwitzerlandSyriaTaiwanThailandTrinidad and TobagoTurkeyUgandaUkraineUruguayUzbekistanVenezuelaVietnamWest IndiesWestern AfricaWestern AsiaWestern EuropeYemenZaireZimbabweAzores
4 or more Vehicles in Household
Income
Poverty
Unemployment
Labor Participation
Family Structure
Vehicle Availability
Education Level
Disability

Arab 4 or more Vehicles in Household
Poor

6.0%
4+ VEHICLES AVAILABLE
14.4/ 100
METRIC RATING
213th/ 347
METRIC RANK

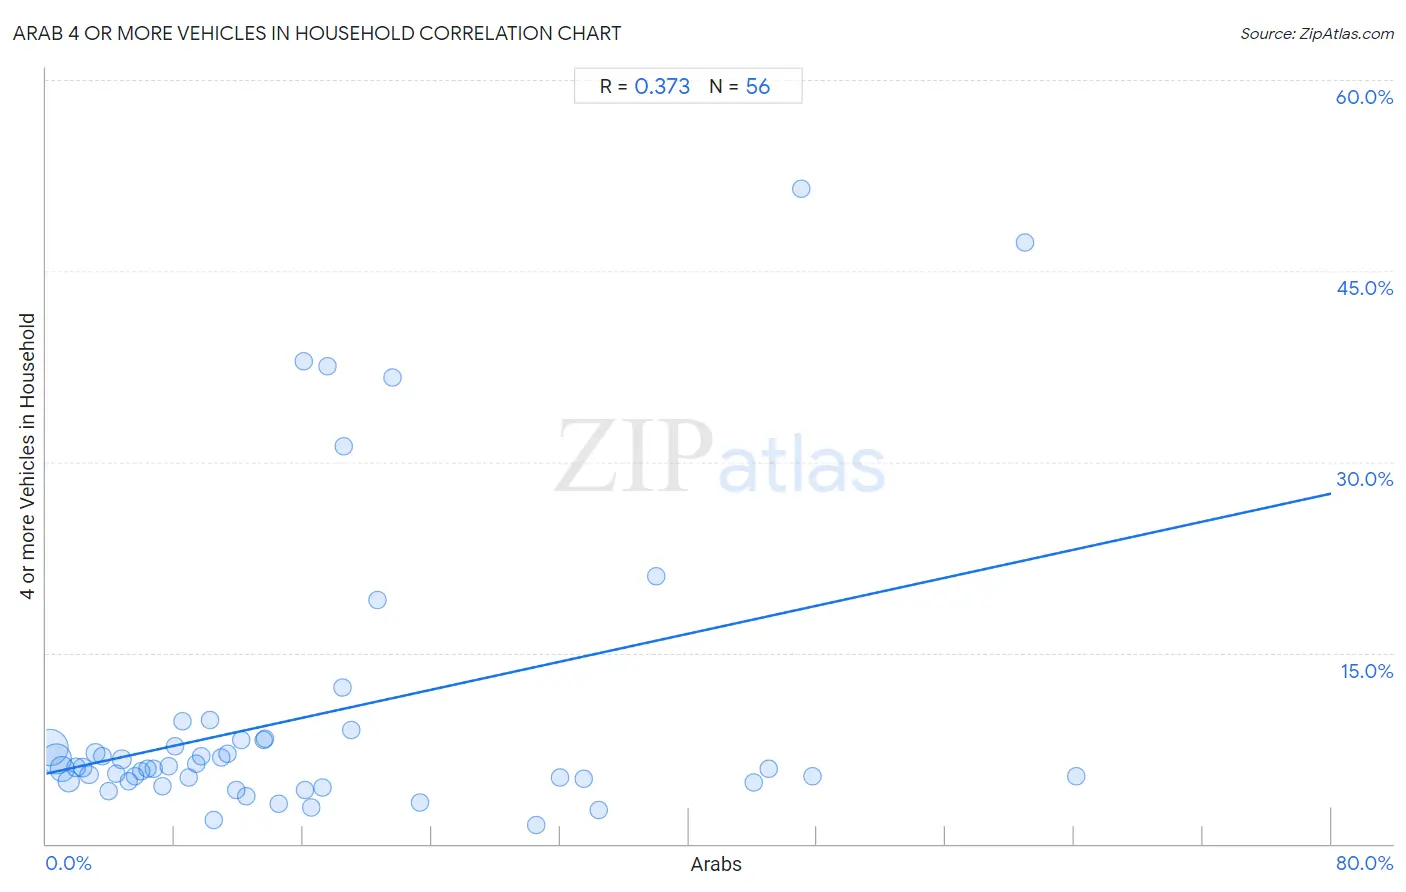
Arab 4 or more Vehicles in Household Correlation Chart

The statistical analysis conducted on geographies consisting of 484,302,602 people shows a mild positive correlation between the proportion of Arabs and percentage of households with 4 or more vehicles available in the United States with a correlation coefficient (R) of 0.373 and weighted average of 6.0%. On average, for every 1% (one percent) increase in Arabs within a typical geography, there is an increase of 0.28% in percentage of households with 4 or more vehicles available.
Arab 4 or more Vehicles in Household
It is essential to understand that the correlation between the percentage of Arabs and percentage of households with 4 or more vehicles available does not imply a direct cause-and-effect relationship. It remains uncertain whether the presence of Arabs influences an upward or downward trend in the level of percentage of households with 4 or more vehicles available within an area, or if Arabs simply ended up residing in those areas with higher or lower levels of percentage of households with 4 or more vehicles available due to other factors.

Demographics Similar to Arabs by 4 or more Vehicles in Household

In terms of 4 or more vehicles in household, the demographic groups most similar to Arabs are Immigrants from Austria (6.0%, a difference of 0.020%), Immigrants from Egypt (6.0%, a difference of 0.060%), Panamanian (6.0%, a difference of 0.080%), Immigrants from China (6.0%, a difference of 0.13%), and Immigrants from Romania (6.0%, a difference of 0.13%).
DemographicsRating | Rank4 or more Vehicles in Household
Kenyans
18.5
/100
|
#206
Poor
6.1%
Immigrants from Chile
16.9
/100
|
#207
Poor
6.1%
Immigrants from Nigeria
15.6
/100
|
#208
Poor
6.1%
Immigrants from Honduras
15.4
/100
|
#209
Poor
6.1%
Immigrants from Zimbabwe
15.1
/100
|
#210
Poor
6.0%
Panamanians
14.8
/100
|
#211
Poor
6.0%
Immigrants from Egypt
14.7
/100
|
#212
Poor
6.0%
Arabs
14.4
/100
|
#213
Poor
6.0%
Immigrants from Austria
14.3
/100
|
#214
Poor
6.0%
Immigrants from China
13.8
/100
|
#215
Poor
6.0%
Immigrants from Romania
13.8
/100
|
#216
Poor
6.0%
Nigerians
12.2
/100
|
#217
Poor
6.0%
Immigrants from Italy
11.0
/100
|
#218
Poor
6.0%
Serbians
11.0
/100
|
#219
Poor
6.0%
Russians
10.3
/100
|
#220
Poor
6.0%

Arab 4 or more Vehicles in Household Correlation Summary

MeasurementArab Data4 or more Vehicles in Household Data
Minimum0.20%1.5%
Maximum64.1%51.4%
Range63.9%50.0%
Mean16.4%10.0%
Median11.6%5.9%
Interquartile 25% (IQ1)5.7%4.9%
Interquartile 75% (IQ3)19.8%8.1%
Interquartile Range (IQR)14.1%3.2%
Standard Deviation (Sample)15.3%11.3%
Standard Deviation (Population)15.2%11.2%

Correlation Details

Arab PercentileSample Size4 or more Vehicles in Household
[
0.0%
-
0.5%
]
0.20%
196,589,4047.6%
[
0.5%
-
1.0%
]
0.61%
127,684,3086.6%
[
0.5%
-
1.0%
]
1.00%
73,491,1205.8%
[
1.0%
-
1.5%
]
1.39%
39,370,2364.9%
[
1.5%
-
2.0%
]
1.84%
15,821,8216.0%
[
2.0%
-
2.5%
]
2.24%
11,064,2886.0%
[
2.5%
-
3.0%
]
2.67%
6,825,1755.4%
[
3.0%
-
3.5%
]
3.06%
3,270,7007.1%
[
3.0%
-
3.5%
]
3.50%
2,055,5326.8%
[
3.5%
-
4.0%
]
3.86%
2,087,3434.1%
[
4.0%
-
4.5%
]
4.32%
937,2855.5%
[
4.5%
-
5.0%
]
4.71%
839,3266.6%
[
5.0%
-
5.5%
]
5.12%
679,3964.9%
[
5.5%
-
6.0%
]
5.54%
440,9355.3%
[
5.5%
-
6.0%
]
5.93%
219,2875.7%
[
6.0%
-
6.5%
]
6.31%
411,8045.9%
[
6.5%
-
7.0%
]
6.67%
283,0265.9%
[
7.0%
-
7.5%
]
7.24%
141,0354.5%
[
7.5%
-
8.0%
]
7.64%
281,9186.0%
[
7.5%
-
8.0%
]
7.98%
198,6847.7%
[
8.0%
-
8.5%
]
8.49%
84,1389.6%
[
8.5%
-
9.0%
]
8.86%
322,7405.2%
[
9.0%
-
9.5%
]
9.37%
30,3856.2%
[
9.5%
-
10.0%
]
9.62%
86,2226.9%
[
10.0%
-
10.5%
]
10.17%
52,9939.7%
[
10.0%
-
10.5%
]
10.42%
97,8461.8%
[
10.5%
-
11.0%
]
10.90%
127,9556.8%
[
11.0%
-
11.5%
]
11.30%
142,8987.1%
[
11.5%
-
12.0%
]
11.83%
47,3714.2%
[
12.0%
-
12.5%
]
12.14%
50,7218.2%
[
12.0%
-
12.5%
]
12.43%
22,0823.7%
[
13.5%
-
14.0%
]
13.53%
37,3968.1%
[
13.5%
-
14.0%
]
13.60%
72,5808.3%
[
14.0%
-
14.5%
]
14.46%
3323.2%
[
15.5%
-
16.0%
]
16.00%
86937.9%
[
16.0%
-
16.5%
]
16.13%
34,0464.2%
[
16.5%
-
17.0%
]
16.52%
1,1322.9%
[
17.0%
-
17.5%
]
17.22%
25,4524.4%
[
17.0%
-
17.5%
]
17.50%
12037.5%
[
18.0%
-
18.5%
]
18.42%
71112.3%
[
18.5%
-
19.0%
]
18.52%
5431.2%
[
19.0%
-
19.5%
]
19.02%
8,5519.0%
[
20.5%
-
21.0%
]
20.62%
16019.1%
[
21.5%
-
22.0%
]
21.57%
5136.7%
[
23.0%
-
23.5%
]
23.30%
43,2133.2%
[
30.5%
-
31.0%
]
30.52%
27,8421.5%
[
31.5%
-
32.0%
]
32.00%
12,4055.2%
[
33.0%
-
33.5%
]
33.47%
62,4925.1%
[
34.0%
-
34.5%
]
34.38%
5,5262.7%
[
38.0%
-
38.5%
]
38.00%
15021.1%
[
44.0%
-
44.5%
]
44.01%
108,4144.9%
[
44.5%
-
45.0%
]
44.98%
40,3925.9%
[
47.0%
-
47.5%
]
47.01%
11751.4%
[
47.5%
-
48.0%
]
47.71%
8,9195.3%
[
60.5%
-
61.0%
]
60.91%
66047.3%
[
64.0%
-
64.5%
]
64.10%
53,0445.3%