Arab Wage/Income Gap

COMPARE

Arab
Race
Ancestry
AfghanAfricanAlaska NativeAlaskan AthabascanAlbanianAleutAlsatianAmericanApacheArabArapahoArgentineanArmenianAssyrian/Chaldean/SyriacAustralianAustrianBahamianBangladeshiBarbadianBasqueBelgianBelizeanBermudanBhutaneseBlackfeetBolivianBrazilianBritishBritish West IndianBulgarianBurmeseCajunCambodianCanadianCape VerdeanCarpatho RusynCelticCentral AmericanCentral American IndianCherokeeCheyenneChickasawChileanChineseChippewaChoctawColombianColvilleComancheCosta RicanCreeCreekCroatianCrowCubanCypriotCzechCzechoslovakianDanishDelawareDominicanDutchDutch West IndianEastern EuropeanEcuadorianEgyptianEnglishEstonianEthiopianEuropeanFijianFilipinoFinnishFrenchFrench American IndianFrench CanadianGermanGerman RussianGhanaianGreekGuamanian/ChamorroGuatemalanGuyaneseHaitianHmongHonduranHopiHoumaHungarianIcelanderIndian (Asian)IndonesianInupiatIranianIraqiIrishIroquoisIsraeliItalianJamaicanJapaneseJordanianKenyanKiowaKoreanLaotianLatvianLebaneseLiberianLithuanianLumbeeLuxembourgerMacedonianMalaysianMalteseMarshalleseMenomineeMexicanMexican American IndianMongolianMoroccanNative HawaiianNavajoNepaleseNew ZealanderNicaraguanNigerianNorthern EuropeanNorwegianOkinawanOsageOttawaPaiutePakistaniPalestinianPanamanianParaguayanPennsylvania GermanPeruvianPimaPolishPortuguesePotawatomiPuebloPuerto RicanPuget Sound SalishRomanianRussianSalvadoranSamoanScandinavianScotch-IrishScottishSeminoleSenegaleseSerbianShoshoneSierra LeoneanSiouxSlavicSlovakSloveneSomaliSouth AfricanSouth AmericanSouth American IndianSoviet UnionSpaniardSpanishSpanish AmericanSpanish American IndianSri LankanSubsaharan AfricanSudaneseSwedishSwissSyrianTaiwaneseThaiTlingit-HaidaTohono O'OdhamTonganTrinidadian and TobagonianTsimshianTurkishU.S. Virgin IslanderUgandanUkrainianUruguayanUteVenezuelanVietnameseWelshWest IndianYakamaYaquiYugoslavianYumanYup'ikZimbabwean
Immigration
NonimmigrantsImmigrantsAfghanistanAfricaAlbaniaArgentinaArmeniaAsiaAustraliaAustriaBahamasBangladeshBarbadosBelarusBelgiumBelizeBoliviaBosnia and HerzegovinaBrazilBulgariaBurma/MyanmarCabo VerdeCambodiaCameroonCanadaCaribbeanCentral AmericaChileChinaColombiaCongoCosta RicaCroatiaCubaCzechoslovakiaDenmarkDominicaDominican RepublicEastern AfricaEastern AsiaEastern EuropeEcuadorEgyptEl SalvadorEnglandEritreaEthiopiaEuropeFijiFranceGermanyGhanaGreeceGrenadaGuatemalaGuyanaHaitiHondurasHong KongHungaryIndiaIndonesiaIranIraqIrelandIsraelItalyJamaicaJapanJordanKazakhstanKenyaKoreaKuwaitLaosLatin AmericaLatviaLebanonLiberiaLithuaniaMalaysiaMexicoMicronesiaMiddle AfricaMoldovaMoroccoNepalNetherlandsNicaraguaNigeriaNorth AmericaNorth MacedoniaNorthern AfricaNorthern EuropeNorwayOceaniaPakistanPanamaPeruPhilippinesPolandPortugalRomaniaRussiaSaudi ArabiaScotlandSenegalSerbiaSierra LeoneSingaporeSomaliaSouth AfricaSouth AmericaSouth Central AsiaSouth Eastern AsiaSouthern EuropeSpainSri LankaSt. Vincent and the GrenadinesSudanSwedenSwitzerlandSyriaTaiwanThailandTrinidad and TobagoTurkeyUgandaUkraineUruguayUzbekistanVenezuelaVietnamWest IndiesWestern AfricaWestern AsiaWestern EuropeYemenZaireZimbabweAzores
Select to Compare
Race
Ancestry
AfghanAfricanAlaska NativeAlaskan AthabascanAlbanianAleutAlsatianAmericanApacheArapahoArgentineanArmenianAssyrian/Chaldean/SyriacAustralianAustrianBahamianBangladeshiBarbadianBasqueBelgianBelizeanBermudanBhutaneseBlackfeetBolivianBrazilianBritishBritish West IndianBulgarianBurmeseCajunCambodianCanadianCape VerdeanCarpatho RusynCelticCentral AmericanCentral American IndianCherokeeCheyenneChickasawChileanChineseChippewaChoctawColombianColvilleComancheCosta RicanCreeCreekCroatianCrowCubanCypriotCzechCzechoslovakianDanishDelawareDominicanDutchDutch West IndianEastern EuropeanEcuadorianEgyptianEnglishEstonianEthiopianEuropeanFijianFilipinoFinnishFrenchFrench American IndianFrench CanadianGermanGerman RussianGhanaianGreekGuamanian/ChamorroGuatemalanGuyaneseHaitianHmongHonduranHopiHoumaHungarianIcelanderIndian (Asian)IndonesianInupiatIranianIraqiIrishIroquoisIsraeliItalianJamaicanJapaneseJordanianKenyanKiowaKoreanLaotianLatvianLebaneseLiberianLithuanianLumbeeLuxembourgerMacedonianMalaysianMalteseMarshalleseMenomineeMexicanMexican American IndianMongolianMoroccanNative HawaiianNavajoNepaleseNew ZealanderNicaraguanNigerianNorthern EuropeanNorwegianOkinawanOsageOttawaPaiutePakistaniPalestinianPanamanianParaguayanPennsylvania GermanPeruvianPimaPolishPortuguesePotawatomiPuebloPuerto RicanPuget Sound SalishRomanianRussianSalvadoranSamoanScandinavianScotch-IrishScottishSeminoleSenegaleseSerbianShoshoneSierra LeoneanSiouxSlavicSlovakSloveneSomaliSouth AfricanSouth AmericanSouth American IndianSoviet UnionSpaniardSpanishSpanish AmericanSpanish American IndianSri LankanSubsaharan AfricanSudaneseSwedishSwissSyrianTaiwaneseThaiTlingit-HaidaTohono O'OdhamTonganTrinidadian and TobagonianTsimshianTurkishU.S. Virgin IslanderUgandanUkrainianUruguayanUteVenezuelanVietnameseWelshWest IndianYakamaYaquiYugoslavianYumanYup'ikZimbabwean
Immigration
NonimmigrantsImmigrantsAfghanistanAfricaAlbaniaArgentinaArmeniaAsiaAustraliaAustriaBahamasBangladeshBarbadosBelarusBelgiumBelizeBoliviaBosnia and HerzegovinaBrazilBulgariaBurma/MyanmarCabo VerdeCambodiaCameroonCanadaCaribbeanCentral AmericaChileChinaColombiaCongoCosta RicaCroatiaCubaCzechoslovakiaDenmarkDominicaDominican RepublicEastern AfricaEastern AsiaEastern EuropeEcuadorEgyptEl SalvadorEnglandEritreaEthiopiaEuropeFijiFranceGermanyGhanaGreeceGrenadaGuatemalaGuyanaHaitiHondurasHong KongHungaryIndiaIndonesiaIranIraqIrelandIsraelItalyJamaicaJapanJordanKazakhstanKenyaKoreaKuwaitLaosLatin AmericaLatviaLebanonLiberiaLithuaniaMalaysiaMexicoMicronesiaMiddle AfricaMoldovaMoroccoNepalNetherlandsNicaraguaNigeriaNorth AmericaNorth MacedoniaNorthern AfricaNorthern EuropeNorwayOceaniaPakistanPanamaPeruPhilippinesPolandPortugalRomaniaRussiaSaudi ArabiaScotlandSenegalSerbiaSierra LeoneSingaporeSomaliaSouth AfricaSouth AmericaSouth Central AsiaSouth Eastern AsiaSouthern EuropeSpainSri LankaSt. Vincent and the GrenadinesSudanSwedenSwitzerlandSyriaTaiwanThailandTrinidad and TobagoTurkeyUgandaUkraineUruguayUzbekistanVenezuelaVietnamWest IndiesWestern AfricaWestern AsiaWestern EuropeYemenZaireZimbabweAzores
Wage/Income Gap
Income
Poverty
Unemployment
Labor Participation
Family Structure
Vehicle Availability
Education Level
Disability

Arab Wage/Income Gap
Poor

26.6%
WAGE/INCOME GAP
12.3/ 100
METRIC RATING
210th/ 347
METRIC RANK

Arab Wage/Income Gap Correlation Chart

The statistical analysis conducted on geographies consisting of 486,307,173 people shows a slight positive correlation between the proportion of Arabs and wage/income gap percentage in the United States with a correlation coefficient (R) of 0.067 and weighted average of 26.6%. On average, for every 1% (one percent) increase in Arabs within a typical geography, there is an increase of 0.031% in wage/income gap percentage.
Arab Wage/Income Gap
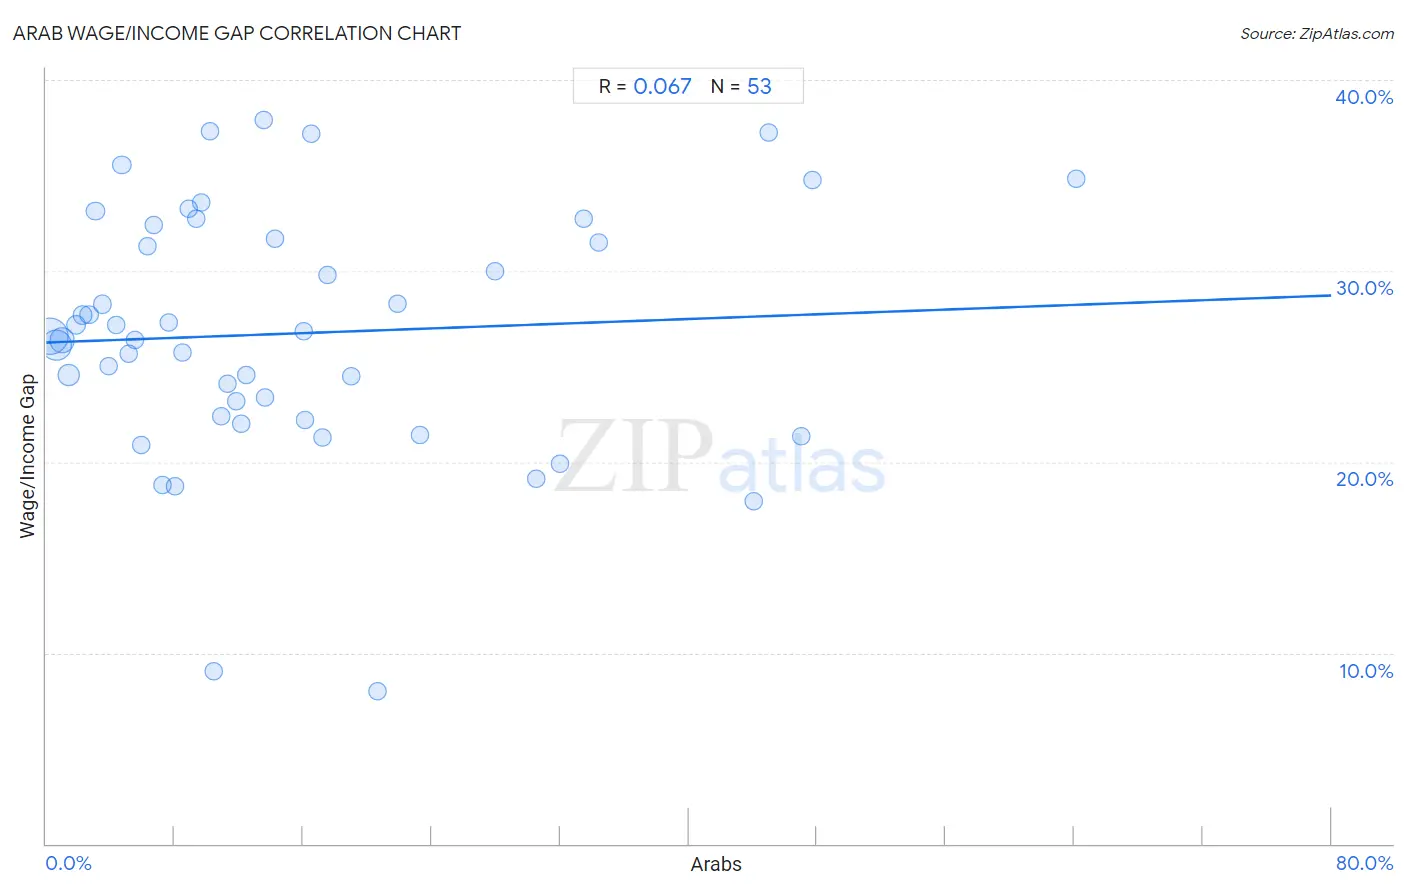
It is essential to understand that the correlation between the percentage of Arabs and wage/income gap percentage does not imply a direct cause-and-effect relationship. It remains uncertain whether the presence of Arabs influences an upward or downward trend in the level of wage/income gap percentage within an area, or if Arabs simply ended up residing in those areas with higher or lower levels of wage/income gap percentage due to other factors.

Demographics Similar to Arabs by Wage/Income Gap

In terms of wage/income gap, the demographic groups most similar to Arabs are Immigrants from Kuwait (26.6%, a difference of 0.040%), Egyptian (26.6%, a difference of 0.060%), Mongolian (26.6%, a difference of 0.13%), Iraqi (26.6%, a difference of 0.16%), and Immigrants from Iraq (26.7%, a difference of 0.31%).
DemographicsRating | RankWage/Income Gap
Immigrants from Eastern Europe
19.2
/100
|
#203
Poor
26.4%
Immigrants from Russia
19.0
/100
|
#204
Poor
26.4%
Immigrants from Southern Europe
17.3
/100
|
#205
Poor
26.4%
Indians (Asian)
16.5
/100
|
#206
Poor
26.4%
Immigrants from Italy
15.8
/100
|
#207
Poor
26.5%
Egyptians
12.7
/100
|
#208
Poor
26.6%
Immigrants from Kuwait
12.6
/100
|
#209
Poor
26.6%
Arabs
12.3
/100
|
#210
Poor
26.6%
Mongolians
11.4
/100
|
#211
Poor
26.6%
Iraqis
11.2
/100
|
#212
Poor
26.6%
Immigrants from Iraq
10.3
/100
|
#213
Poor
26.7%
Immigrants from China
10.3
/100
|
#214
Poor
26.7%
Yugoslavians
9.7
/100
|
#215
Tragic
26.7%
Immigrants from Portugal
9.5
/100
|
#216
Tragic
26.7%
Brazilians
9.2
/100
|
#217
Tragic
26.7%

Arab Wage/Income Gap Correlation Summary

MeasurementArab DataWage/Income Gap Data
Minimum0.20%8.0%
Maximum64.1%37.9%
Range63.9%29.9%
Mean15.3%26.7%
Median10.9%26.6%
Interquartile 25% (IQ1)5.3%22.3%
Interquartile 75% (IQ3)19.8%32.0%
Interquartile Range (IQR)14.5%9.7%
Standard Deviation (Sample)14.3%6.5%
Standard Deviation (Population)14.1%6.4%

Correlation Details

Arab PercentileSample SizeWage/Income Gap
[
0.0%
-
0.5%
]
0.20%
197,232,77726.6%
[
0.5%
-
1.0%
]
0.61%
128,122,05026.1%
[
0.5%
-
1.0%
]
1.00%
73,959,00526.4%
[
1.0%
-
1.5%
]
1.39%
39,483,20524.5%
[
1.5%
-
2.0%
]
1.84%
15,933,81627.2%
[
2.0%
-
2.5%
]
2.24%
11,157,91727.7%
[
2.5%
-
3.0%
]
2.67%
6,863,64427.7%
[
3.0%
-
3.5%
]
3.06%
3,295,87833.1%
[
3.0%
-
3.5%
]
3.50%
2,099,14728.3%
[
3.5%
-
4.0%
]
3.87%
2,130,23825.0%
[
4.0%
-
4.5%
]
4.32%
936,63827.2%
[
4.5%
-
5.0%
]
4.71%
837,24235.5%
[
5.0%
-
5.5%
]
5.12%
680,83325.7%
[
5.5%
-
6.0%
]
5.54%
439,73226.4%
[
5.5%
-
6.0%
]
5.93%
219,14920.9%
[
6.0%
-
6.5%
]
6.31%
409,46131.3%
[
6.5%
-
7.0%
]
6.67%
280,73732.4%
[
7.0%
-
7.5%
]
7.24%
140,49718.8%
[
7.5%
-
8.0%
]
7.64%
279,20427.3%
[
7.5%
-
8.0%
]
7.98%
198,68418.7%
[
8.0%
-
8.5%
]
8.49%
83,81325.7%
[
8.5%
-
9.0%
]
8.86%
321,30133.3%
[
9.0%
-
9.5%
]
9.37%
29,79932.8%
[
9.5%
-
10.0%
]
9.62%
86,22233.6%
[
10.0%
-
10.5%
]
10.17%
52,28337.3%
[
10.0%
-
10.5%
]
10.42%
97,8469.1%
[
10.5%
-
11.0%
]
10.90%
127,87222.4%
[
11.0%
-
11.5%
]
11.30%
144,45824.1%
[
11.5%
-
12.0%
]
11.83%
46,97923.2%
[
12.0%
-
12.5%
]
12.14%
49,99522.0%
[
12.0%
-
12.5%
]
12.43%
22,08224.6%
[
13.5%
-
14.0%
]
13.53%
37,75337.9%
[
13.5%
-
14.0%
]
13.60%
72,58023.3%
[
14.0%
-
14.5%
]
14.24%
1,21531.7%
[
16.0%
-
16.5%
]
16.00%
82526.8%
[
16.0%
-
16.5%
]
16.13%
34,04622.2%
[
16.5%
-
17.0%
]
16.52%
1,13237.2%
[
17.0%
-
17.5%
]
17.22%
25,33721.2%
[
17.0%
-
17.5%
]
17.50%
12029.8%
[
19.0%
-
19.5%
]
19.02%
8,55124.5%
[
20.5%
-
21.0%
]
20.62%
1608.0%
[
21.5%
-
22.0%
]
21.88%
9628.3%
[
23.0%
-
23.5%
]
23.30%
43,21321.4%
[
27.5%
-
28.0%
]
27.95%
50830.0%
[
30.5%
-
31.0%
]
30.52%
27,84219.1%
[
31.5%
-
32.0%
]
32.00%
12,40519.9%
[
33.0%
-
33.5%
]
33.47%
62,47432.7%
[
34.0%
-
34.5%
]
34.38%
5,52631.5%
[
44.0%
-
44.5%
]
44.01%
108,41418.0%
[
44.5%
-
45.0%
]
44.98%
40,39237.3%
[
47.0%
-
47.5%
]
47.01%
11721.3%
[
47.5%
-
48.0%
]
47.71%
8,91934.8%
[
64.0%
-
64.5%
]
64.10%
53,04434.9%