Arab 3 or more Vehicles in Household
COMPARE
Arab
Select to Compare
3 or more Vehicles in Household
Arab 3 or more Vehicles in Household
18.9%
3+ VEHICLES AVAILABLE
17.7/ 100
METRIC RATING
201st/ 347
METRIC RANK
Arab 3 or more Vehicles in Household Correlation Chart
The statistical analysis conducted on geographies consisting of 486,191,468 people shows a moderate positive correlation between the proportion of Arabs and percentage of households with 3 or more vehicles available in the United States with a correlation coefficient (R) of 0.492 and weighted average of 18.9%. On average, for every 1% (one percent) increase in Arabs within a typical geography, there is an increase of 0.66% in percentage of households with 3 or more vehicles available.
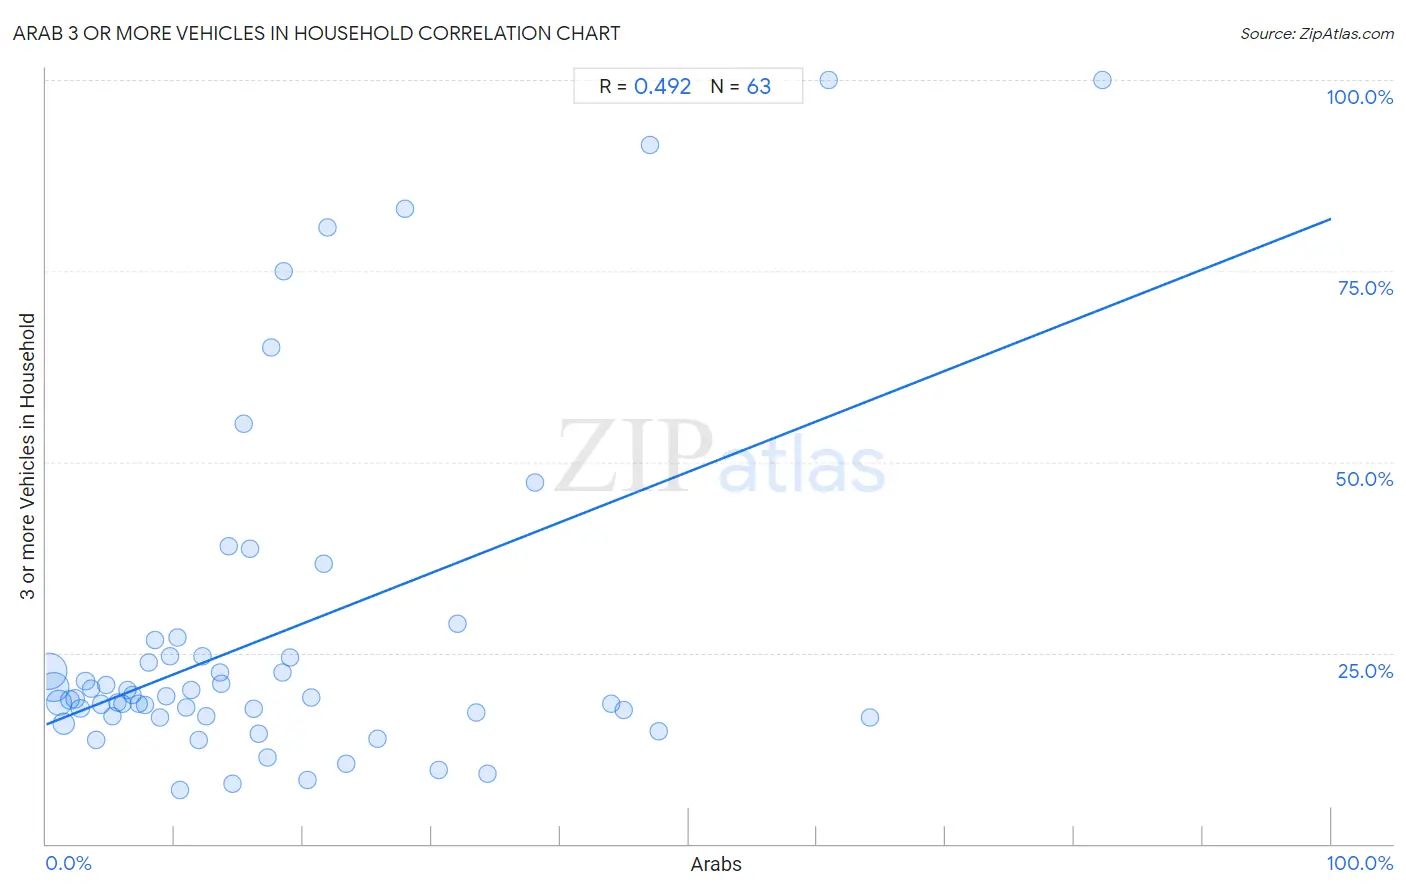
It is essential to understand that the correlation between the percentage of Arabs and percentage of households with 3 or more vehicles available does not imply a direct cause-and-effect relationship. It remains uncertain whether the presence of Arabs influences an upward or downward trend in the level of percentage of households with 3 or more vehicles available within an area, or if Arabs simply ended up residing in those areas with higher or lower levels of percentage of households with 3 or more vehicles available due to other factors.
Demographics Similar to Arabs by 3 or more Vehicles in Household
In terms of 3 or more vehicles in household, the demographic groups most similar to Arabs are Argentinean (18.9%, a difference of 0.060%), Immigrants from Norway (19.0%, a difference of 0.16%), Egyptian (19.0%, a difference of 0.22%), Immigrants from Austria (18.9%, a difference of 0.33%), and Tohono O'odham (18.9%, a difference of 0.42%).
| Demographics | Rating | Rank | 3 or more Vehicles in Household |
| Serbians | 24.0 /100 | #194 | Fair 19.1% |
| Immigrants from Moldova | 23.6 /100 | #195 | Fair 19.1% |
| Central American Indians | 22.2 /100 | #196 | Fair 19.0% |
| Immigrants from Japan | 22.0 /100 | #197 | Fair 19.0% |
| Egyptians | 19.5 /100 | #198 | Poor 19.0% |
| Immigrants from Norway | 19.0 /100 | #199 | Poor 19.0% |
| Argentineans | 18.2 /100 | #200 | Poor 18.9% |
| Arabs | 17.7 /100 | #201 | Poor 18.9% |
| Immigrants from Austria | 15.4 /100 | #202 | Poor 18.9% |
| Tohono O'odham | 14.8 /100 | #203 | Poor 18.9% |
| Immigrants from Romania | 14.6 /100 | #204 | Poor 18.9% |
| Russians | 14.2 /100 | #205 | Poor 18.8% |
| Immigrants from Eastern Asia | 14.1 /100 | #206 | Poor 18.8% |
| Immigrants from Chile | 13.6 /100 | #207 | Poor 18.8% |
| Immigrants from Burma/Myanmar | 13.6 /100 | #208 | Poor 18.8% |
Arab 3 or more Vehicles in Household Correlation Summary
| Measurement | Arab Data | 3 or more Vehicles in Household Data |
| Minimum | 0.20% | 7.1% |
| Maximum | 82.2% | 100.0% |
| Range | 82.0% | 92.9% |
| Mean | 17.9% | 27.5% |
| Median | 13.5% | 19.1% |
| Interquartile 25% (IQ1) | 6.3% | 16.7% |
| Interquartile 75% (IQ3) | 21.9% | 24.6% |
| Interquartile Range (IQR) | 15.6% | 7.9% |
| Standard Deviation (Sample) | 16.8% | 22.5% |
| Standard Deviation (Population) | 16.6% | 22.3% |
Correlation Details
| Arab Percentile | Sample Size | 3 or more Vehicles in Household |
[ 0.0% - 0.5% ] 0.20% | 197,218,962 | 22.6% |
[ 0.5% - 1.0% ] 0.61% | 128,102,367 | 20.5% |
[ 0.5% - 1.0% ] 1.00% | 73,881,281 | 18.5% |
[ 1.0% - 1.5% ] 1.39% | 39,462,899 | 15.7% |
[ 1.5% - 2.0% ] 1.84% | 15,905,323 | 18.8% |
[ 2.0% - 2.5% ] 2.24% | 11,149,489 | 19.0% |
[ 2.5% - 3.0% ] 2.67% | 6,865,523 | 17.7% |
[ 3.0% - 3.5% ] 3.06% | 3,303,884 | 21.3% |
[ 3.0% - 3.5% ] 3.50% | 2,096,454 | 20.3% |
[ 3.5% - 4.0% ] 3.87% | 2,141,312 | 13.6% |
[ 4.0% - 4.5% ] 4.32% | 940,941 | 18.3% |
[ 4.5% - 5.0% ] 4.71% | 839,326 | 20.8% |
[ 5.0% - 5.5% ] 5.12% | 681,602 | 16.7% |
[ 5.5% - 6.0% ] 5.54% | 442,778 | 18.6% |
[ 5.5% - 6.0% ] 5.93% | 219,868 | 18.3% |
[ 6.0% - 6.5% ] 6.31% | 414,001 | 20.1% |
[ 6.5% - 7.0% ] 6.67% | 283,117 | 19.4% |
[ 7.0% - 7.5% ] 7.24% | 141,035 | 18.3% |
[ 7.5% - 8.0% ] 7.64% | 282,500 | 18.1% |
[ 7.5% - 8.0% ] 7.98% | 199,092 | 23.7% |
[ 8.0% - 8.5% ] 8.49% | 84,443 | 26.7% |
[ 8.5% - 9.0% ] 8.86% | 322,888 | 16.6% |
[ 9.0% - 9.5% ] 9.36% | 30,824 | 19.3% |
[ 9.5% - 10.0% ] 9.63% | 86,980 | 24.6% |
[ 10.0% - 10.5% ] 10.17% | 53,472 | 27.1% |
[ 10.0% - 10.5% ] 10.42% | 97,846 | 7.1% |
[ 10.5% - 11.0% ] 10.90% | 127,955 | 17.9% |
[ 11.0% - 11.5% ] 11.30% | 145,544 | 20.0% |
[ 11.5% - 12.0% ] 11.83% | 47,371 | 13.5% |
[ 12.0% - 12.5% ] 12.14% | 51,471 | 24.5% |
[ 12.0% - 12.5% ] 12.43% | 22,082 | 16.7% |
[ 13.5% - 14.0% ] 13.53% | 37,396 | 22.5% |
[ 13.5% - 14.0% ] 13.60% | 72,809 | 20.9% |
[ 14.0% - 14.5% ] 14.24% | 1,215 | 38.9% |
[ 14.0% - 14.5% ] 14.46% | 332 | 7.9% |
[ 15.0% - 15.5% ] 15.38% | 156 | 55.1% |
[ 15.5% - 16.0% ] 15.87% | 2,042 | 38.6% |
[ 16.0% - 16.5% ] 16.13% | 34,046 | 17.6% |
[ 16.5% - 17.0% ] 16.52% | 1,132 | 14.4% |
[ 17.0% - 17.5% ] 17.22% | 25,511 | 11.3% |
[ 17.0% - 17.5% ] 17.50% | 120 | 65.0% |
[ 18.0% - 18.5% ] 18.42% | 711 | 22.5% |
[ 18.5% - 19.0% ] 18.52% | 54 | 75.0% |
[ 19.0% - 19.5% ] 19.02% | 8,551 | 24.4% |
[ 20.0% - 20.5% ] 20.38% | 211 | 8.3% |
[ 20.5% - 21.0% ] 20.62% | 160 | 19.1% |
[ 21.5% - 22.0% ] 21.57% | 51 | 36.7% |
[ 21.5% - 22.0% ] 21.88% | 96 | 80.8% |
[ 23.0% - 23.5% ] 23.30% | 43,213 | 10.5% |
[ 25.5% - 26.0% ] 25.80% | 314 | 13.7% |
[ 27.5% - 28.0% ] 27.93% | 598 | 83.2% |
[ 30.5% - 31.0% ] 30.52% | 27,894 | 9.6% |
[ 31.5% - 32.0% ] 32.00% | 12,405 | 28.8% |
[ 33.0% - 33.5% ] 33.47% | 62,492 | 17.2% |
[ 34.0% - 34.5% ] 34.38% | 5,526 | 9.2% |
[ 38.0% - 38.5% ] 38.00% | 150 | 47.4% |
[ 44.0% - 44.5% ] 44.01% | 108,414 | 18.3% |
[ 44.5% - 45.0% ] 44.98% | 40,392 | 17.4% |
[ 47.0% - 47.5% ] 47.01% | 117 | 91.4% |
[ 47.5% - 48.0% ] 47.71% | 8,919 | 14.8% |
[ 60.5% - 61.0% ] 60.91% | 660 | 100.0% |
[ 64.0% - 64.5% ] 64.10% | 53,044 | 16.5% |
[ 82.0% - 82.5% ] 82.24% | 107 | 100.0% |