Ute 2 or more Vehicles in Household

COMPARE

Ute
Race
Ancestry
AfghanAfricanAlaska NativeAlaskan AthabascanAlbanianAleutAlsatianAmericanApacheArabArapahoArgentineanArmenianAssyrian/Chaldean/SyriacAustralianAustrianBahamianBangladeshiBarbadianBasqueBelgianBelizeanBermudanBhutaneseBlackfeetBolivianBrazilianBritishBritish West IndianBulgarianBurmeseCajunCambodianCanadianCape VerdeanCarpatho RusynCelticCentral AmericanCentral American IndianCherokeeCheyenneChickasawChileanChineseChippewaChoctawColombianColvilleComancheCosta RicanCreeCreekCroatianCrowCubanCypriotCzechCzechoslovakianDanishDelawareDominicanDutchDutch West IndianEastern EuropeanEcuadorianEgyptianEnglishEstonianEthiopianEuropeanFijianFilipinoFinnishFrenchFrench American IndianFrench CanadianGermanGerman RussianGhanaianGreekGuamanian/ChamorroGuatemalanGuyaneseHaitianHmongHonduranHopiHoumaHungarianIcelanderIndian (Asian)IndonesianInupiatIranianIraqiIrishIroquoisIsraeliItalianJamaicanJapaneseJordanianKenyanKiowaKoreanLaotianLatvianLebaneseLiberianLithuanianLumbeeLuxembourgerMacedonianMalaysianMalteseMarshalleseMenomineeMexicanMexican American IndianMongolianMoroccanNative HawaiianNavajoNepaleseNew ZealanderNicaraguanNigerianNorthern EuropeanNorwegianOkinawanOsageOttawaPaiutePakistaniPalestinianPanamanianParaguayanPennsylvania GermanPeruvianPimaPolishPortuguesePotawatomiPuebloPuerto RicanPuget Sound SalishRomanianRussianSalvadoranSamoanScandinavianScotch-IrishScottishSeminoleSenegaleseSerbianShoshoneSierra LeoneanSiouxSlavicSlovakSloveneSomaliSouth AfricanSouth AmericanSouth American IndianSoviet UnionSpaniardSpanishSpanish AmericanSpanish American IndianSri LankanSubsaharan AfricanSudaneseSwedishSwissSyrianTaiwaneseThaiTlingit-HaidaTohono O'OdhamTonganTrinidadian and TobagonianTsimshianTurkishU.S. Virgin IslanderUgandanUkrainianUruguayanUteVenezuelanVietnameseWelshWest IndianYakamaYaquiYugoslavianYumanYup'ikZimbabwean
Immigration
NonimmigrantsImmigrantsAfghanistanAfricaAlbaniaArgentinaArmeniaAsiaAustraliaAustriaBahamasBangladeshBarbadosBelarusBelgiumBelizeBoliviaBosnia and HerzegovinaBrazilBulgariaBurma/MyanmarCabo VerdeCambodiaCameroonCanadaCaribbeanCentral AmericaChileChinaColombiaCongoCosta RicaCroatiaCubaCzechoslovakiaDenmarkDominicaDominican RepublicEastern AfricaEastern AsiaEastern EuropeEcuadorEgyptEl SalvadorEnglandEritreaEthiopiaEuropeFijiFranceGermanyGhanaGreeceGrenadaGuatemalaGuyanaHaitiHondurasHong KongHungaryIndiaIndonesiaIranIraqIrelandIsraelItalyJamaicaJapanJordanKazakhstanKenyaKoreaKuwaitLaosLatin AmericaLatviaLebanonLiberiaLithuaniaMalaysiaMexicoMicronesiaMiddle AfricaMoldovaMoroccoNepalNetherlandsNicaraguaNigeriaNorth AmericaNorth MacedoniaNorthern AfricaNorthern EuropeNorwayOceaniaPakistanPanamaPeruPhilippinesPolandPortugalRomaniaRussiaSaudi ArabiaScotlandSenegalSerbiaSierra LeoneSingaporeSomaliaSouth AfricaSouth AmericaSouth Central AsiaSouth Eastern AsiaSouthern EuropeSpainSri LankaSt. Vincent and the GrenadinesSudanSwedenSwitzerlandSyriaTaiwanThailandTrinidad and TobagoTurkeyUgandaUkraineUruguayUzbekistanVenezuelaVietnamWest IndiesWestern AfricaWestern AsiaWestern EuropeYemenZaireZimbabweAzores
Select to Compare
Race
Ancestry
AfghanAfricanAlaska NativeAlaskan AthabascanAlbanianAleutAlsatianAmericanApacheArabArapahoArgentineanArmenianAssyrian/Chaldean/SyriacAustralianAustrianBahamianBangladeshiBarbadianBasqueBelgianBelizeanBermudanBhutaneseBlackfeetBolivianBrazilianBritishBritish West IndianBulgarianBurmeseCajunCambodianCanadianCape VerdeanCarpatho RusynCelticCentral AmericanCentral American IndianCherokeeCheyenneChickasawChileanChineseChippewaChoctawColombianColvilleComancheCosta RicanCreeCreekCroatianCrowCubanCypriotCzechCzechoslovakianDanishDelawareDominicanDutchDutch West IndianEastern EuropeanEcuadorianEgyptianEnglishEstonianEthiopianEuropeanFijianFilipinoFinnishFrenchFrench American IndianFrench CanadianGermanGerman RussianGhanaianGreekGuamanian/ChamorroGuatemalanGuyaneseHaitianHmongHonduranHopiHoumaHungarianIcelanderIndian (Asian)IndonesianInupiatIranianIraqiIrishIroquoisIsraeliItalianJamaicanJapaneseJordanianKenyanKiowaKoreanLaotianLatvianLebaneseLiberianLithuanianLumbeeLuxembourgerMacedonianMalaysianMalteseMarshalleseMenomineeMexicanMexican American IndianMongolianMoroccanNative HawaiianNavajoNepaleseNew ZealanderNicaraguanNigerianNorthern EuropeanNorwegianOkinawanOsageOttawaPaiutePakistaniPalestinianPanamanianParaguayanPennsylvania GermanPeruvianPimaPolishPortuguesePotawatomiPuebloPuerto RicanPuget Sound SalishRomanianRussianSalvadoranSamoanScandinavianScotch-IrishScottishSeminoleSenegaleseSerbianShoshoneSierra LeoneanSiouxSlavicSlovakSloveneSomaliSouth AfricanSouth AmericanSouth American IndianSoviet UnionSpaniardSpanishSpanish AmericanSpanish American IndianSri LankanSubsaharan AfricanSudaneseSwedishSwissSyrianTaiwaneseThaiTlingit-HaidaTohono O'OdhamTonganTrinidadian and TobagonianTsimshianTurkishU.S. Virgin IslanderUgandanUkrainianUruguayanVenezuelanVietnameseWelshWest IndianYakamaYaquiYugoslavianYumanYup'ikZimbabwean
Immigration
NonimmigrantsImmigrantsAfghanistanAfricaAlbaniaArgentinaArmeniaAsiaAustraliaAustriaBahamasBangladeshBarbadosBelarusBelgiumBelizeBoliviaBosnia and HerzegovinaBrazilBulgariaBurma/MyanmarCabo VerdeCambodiaCameroonCanadaCaribbeanCentral AmericaChileChinaColombiaCongoCosta RicaCroatiaCubaCzechoslovakiaDenmarkDominicaDominican RepublicEastern AfricaEastern AsiaEastern EuropeEcuadorEgyptEl SalvadorEnglandEritreaEthiopiaEuropeFijiFranceGermanyGhanaGreeceGrenadaGuatemalaGuyanaHaitiHondurasHong KongHungaryIndiaIndonesiaIranIraqIrelandIsraelItalyJamaicaJapanJordanKazakhstanKenyaKoreaKuwaitLaosLatin AmericaLatviaLebanonLiberiaLithuaniaMalaysiaMexicoMicronesiaMiddle AfricaMoldovaMoroccoNepalNetherlandsNicaraguaNigeriaNorth AmericaNorth MacedoniaNorthern AfricaNorthern EuropeNorwayOceaniaPakistanPanamaPeruPhilippinesPolandPortugalRomaniaRussiaSaudi ArabiaScotlandSenegalSerbiaSierra LeoneSingaporeSomaliaSouth AfricaSouth AmericaSouth Central AsiaSouth Eastern AsiaSouthern EuropeSpainSri LankaSt. Vincent and the GrenadinesSudanSwedenSwitzerlandSyriaTaiwanThailandTrinidad and TobagoTurkeyUgandaUkraineUruguayUzbekistanVenezuelaVietnamWest IndiesWestern AfricaWestern AsiaWestern EuropeYemenZaireZimbabweAzores
2 or more Vehicles in Household
Income
Poverty
Unemployment
Labor Participation
Family Structure
Vehicle Availability
Education Level
Disability

Ute 2 or more Vehicles in Household
Exceptional

56.6%
2+ VEHICLES AVAILABLE
90.4/ 100
METRIC RATING
129th/ 347
METRIC RANK

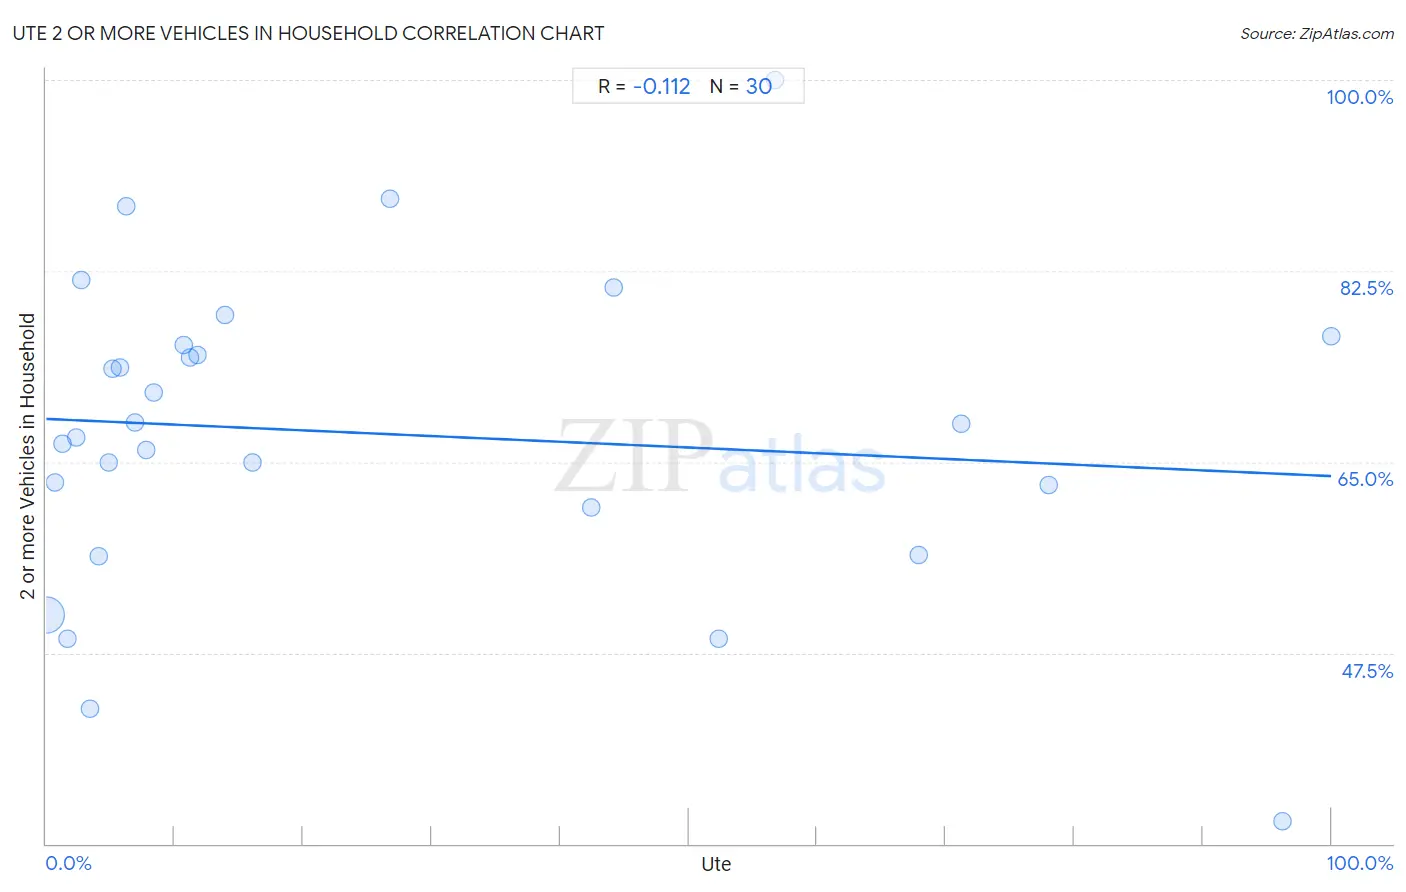
Ute 2 or more Vehicles in Household Correlation Chart

The statistical analysis conducted on geographies consisting of 55,668,301 people shows a poor negative correlation between the proportion of Ute and percentage of households with 2 or more vehicles available in the United States with a correlation coefficient (R) of -0.112 and weighted average of 56.6%. On average, for every 1% (one percent) increase in Ute within a typical geography, there is a decrease of 0.052% in percentage of households with 2 or more vehicles available.
Ute 2 or more Vehicles in Household
It is essential to understand that the correlation between the percentage of Ute and percentage of households with 2 or more vehicles available does not imply a direct cause-and-effect relationship. It remains uncertain whether the presence of Ute influences an upward or downward trend in the level of percentage of households with 2 or more vehicles available within an area, or if Ute simply ended up residing in those areas with higher or lower levels of percentage of households with 2 or more vehicles available due to other factors.

Demographics Similar to Ute by 2 or more Vehicles in Household

In terms of 2 or more vehicles in household, the demographic groups most similar to Ute are Immigrants from South Central Asia (56.6%, a difference of 0.020%), Immigrants from Thailand (56.6%, a difference of 0.030%), Yugoslavian (56.6%, a difference of 0.040%), Estonian (56.6%, a difference of 0.070%), and Bulgarian (56.5%, a difference of 0.070%).
DemographicsRating | Rank2 or more Vehicles in Household
Immigrants from South Africa
92.5
/100
|
#122
Exceptional
56.7%
Australians
91.8
/100
|
#123
Exceptional
56.7%
New Zealanders
91.8
/100
|
#124
Exceptional
56.7%
Tsimshian
91.6
/100
|
#125
Exceptional
56.7%
Estonians
90.9
/100
|
#126
Exceptional
56.6%
Immigrants from Thailand
90.7
/100
|
#127
Exceptional
56.6%
Immigrants from South Central Asia
90.5
/100
|
#128
Exceptional
56.6%
Ute
90.4
/100
|
#129
Exceptional
56.6%
Yugoslavians
90.0
/100
|
#130
Exceptional
56.6%
Bulgarians
89.7
/100
|
#131
Excellent
56.5%
Hungarians
89.1
/100
|
#132
Excellent
56.5%
Comanche
88.4
/100
|
#133
Excellent
56.5%
Immigrants from the Azores
86.6
/100
|
#134
Excellent
56.4%
Blackfeet
86.5
/100
|
#135
Excellent
56.4%
Immigrants from Asia
86.0
/100
|
#136
Excellent
56.3%

Ute 2 or more Vehicles in Household Correlation Summary

MeasurementUte Data2 or more Vehicles in Household Data
Minimum0.028%32.0%
Maximum100.0%100.0%
Range100.0%68.0%
Mean25.3%67.6%
Median9.5%67.9%
Interquartile 25% (IQ1)4.1%60.8%
Interquartile 75% (IQ3)44.1%75.7%
Interquartile Range (IQR)40.0%14.9%
Standard Deviation (Sample)30.7%14.4%
Standard Deviation (Population)30.2%14.2%

Correlation Details

Ute PercentileSample Size2 or more Vehicles in Household
[
0.0%
-
0.5%
]
0.028%
55,248,49550.9%
[
0.5%
-
1.0%
]
0.68%
249,34463.1%
[
1.0%
-
1.5%
]
1.22%
56,63566.7%
[
1.5%
-
2.0%
]
1.67%
10,15948.7%
[
2.0%
-
2.5%
]
2.33%
50,99867.2%
[
2.5%
-
3.0%
]
2.75%
8,45881.7%
[
3.0%
-
3.5%
]
3.36%
38742.4%
[
4.0%
-
4.5%
]
4.09%
2,00456.3%
[
4.5%
-
5.0%
]
4.86%
8,83064.9%
[
5.0%
-
5.5%
]
5.13%
1,15173.6%
[
5.5%
-
6.0%
]
5.71%
14,89473.6%
[
6.0%
-
6.5%
]
6.22%
49888.4%
[
6.5%
-
7.0%
]
6.87%
77168.6%
[
7.5%
-
8.0%
]
7.81%
1,75466.1%
[
8.0%
-
8.5%
]
8.33%
1,28571.3%
[
10.5%
-
11.0%
]
10.75%
57775.7%
[
11.0%
-
11.5%
]
11.16%
48474.6%
[
11.5%
-
12.0%
]
11.76%
5,49574.7%
[
13.5%
-
14.0%
]
13.93%
24478.5%
[
16.0%
-
16.5%
]
16.07%
61664.9%
[
26.5%
-
27.0%
]
26.77%
31089.2%
[
42.0%
-
42.5%
]
42.40%
28360.8%
[
44.0%
-
44.5%
]
44.12%
13681.0%
[
52.0%
-
52.5%
]
52.36%
19148.8%
[
56.5%
-
57.0%
]
56.67%
60100.0%
[
67.5%
-
68.0%
]
67.87%
83156.5%
[
71.0%
-
71.5%
]
71.25%
1,18668.5%
[
78.0%
-
78.5%
]
78.06%
1,69162.9%
[
96.0%
-
96.5%
]
96.19%
47232.0%
[
99.5%
-
100.0%
]
100.00%
6276.5%