Ute GED/Equivalency

COMPARE

Ute
Race
Ancestry
AfghanAfricanAlaska NativeAlaskan AthabascanAlbanianAleutAlsatianAmericanApacheArabArapahoArgentineanArmenianAssyrian/Chaldean/SyriacAustralianAustrianBahamianBangladeshiBarbadianBasqueBelgianBelizeanBermudanBhutaneseBlackfeetBolivianBrazilianBritishBritish West IndianBulgarianBurmeseCajunCambodianCanadianCape VerdeanCarpatho RusynCelticCentral AmericanCentral American IndianCherokeeCheyenneChickasawChileanChineseChippewaChoctawColombianColvilleComancheCosta RicanCreeCreekCroatianCrowCubanCypriotCzechCzechoslovakianDanishDelawareDominicanDutchDutch West IndianEastern EuropeanEcuadorianEgyptianEnglishEstonianEthiopianEuropeanFijianFilipinoFinnishFrenchFrench American IndianFrench CanadianGermanGerman RussianGhanaianGreekGuamanian/ChamorroGuatemalanGuyaneseHaitianHmongHonduranHopiHoumaHungarianIcelanderIndian (Asian)IndonesianInupiatIranianIraqiIrishIroquoisIsraeliItalianJamaicanJapaneseJordanianKenyanKiowaKoreanLaotianLatvianLebaneseLiberianLithuanianLumbeeLuxembourgerMacedonianMalaysianMalteseMarshalleseMenomineeMexicanMexican American IndianMongolianMoroccanNative HawaiianNavajoNepaleseNew ZealanderNicaraguanNigerianNorthern EuropeanNorwegianOkinawanOsageOttawaPaiutePakistaniPalestinianPanamanianParaguayanPennsylvania GermanPeruvianPimaPolishPortuguesePotawatomiPuebloPuerto RicanPuget Sound SalishRomanianRussianSalvadoranSamoanScandinavianScotch-IrishScottishSeminoleSenegaleseSerbianShoshoneSierra LeoneanSiouxSlavicSlovakSloveneSomaliSouth AfricanSouth AmericanSouth American IndianSoviet UnionSpaniardSpanishSpanish AmericanSpanish American IndianSri LankanSubsaharan AfricanSudaneseSwedishSwissSyrianTaiwaneseThaiTlingit-HaidaTohono O'OdhamTonganTrinidadian and TobagonianTsimshianTurkishU.S. Virgin IslanderUgandanUkrainianUruguayanUteVenezuelanVietnameseWelshWest IndianYakamaYaquiYugoslavianYumanYup'ikZimbabwean
Immigration
NonimmigrantsImmigrantsAfghanistanAfricaAlbaniaArgentinaArmeniaAsiaAustraliaAustriaBahamasBangladeshBarbadosBelarusBelgiumBelizeBoliviaBosnia and HerzegovinaBrazilBulgariaBurma/MyanmarCabo VerdeCambodiaCameroonCanadaCaribbeanCentral AmericaChileChinaColombiaCongoCosta RicaCroatiaCubaCzechoslovakiaDenmarkDominicaDominican RepublicEastern AfricaEastern AsiaEastern EuropeEcuadorEgyptEl SalvadorEnglandEritreaEthiopiaEuropeFijiFranceGermanyGhanaGreeceGrenadaGuatemalaGuyanaHaitiHondurasHong KongHungaryIndiaIndonesiaIranIraqIrelandIsraelItalyJamaicaJapanJordanKazakhstanKenyaKoreaKuwaitLaosLatin AmericaLatviaLebanonLiberiaLithuaniaMalaysiaMexicoMicronesiaMiddle AfricaMoldovaMoroccoNepalNetherlandsNicaraguaNigeriaNorth AmericaNorth MacedoniaNorthern AfricaNorthern EuropeNorwayOceaniaPakistanPanamaPeruPhilippinesPolandPortugalRomaniaRussiaSaudi ArabiaScotlandSenegalSerbiaSierra LeoneSingaporeSomaliaSouth AfricaSouth AmericaSouth Central AsiaSouth Eastern AsiaSouthern EuropeSpainSri LankaSt. Vincent and the GrenadinesSudanSwedenSwitzerlandSyriaTaiwanThailandTrinidad and TobagoTurkeyUgandaUkraineUruguayUzbekistanVenezuelaVietnamWest IndiesWestern AfricaWestern AsiaWestern EuropeYemenZaireZimbabweAzores
Select to Compare
Race
Ancestry
AfghanAfricanAlaska NativeAlaskan AthabascanAlbanianAleutAlsatianAmericanApacheArabArapahoArgentineanArmenianAssyrian/Chaldean/SyriacAustralianAustrianBahamianBangladeshiBarbadianBasqueBelgianBelizeanBermudanBhutaneseBlackfeetBolivianBrazilianBritishBritish West IndianBulgarianBurmeseCajunCambodianCanadianCape VerdeanCarpatho RusynCelticCentral AmericanCentral American IndianCherokeeCheyenneChickasawChileanChineseChippewaChoctawColombianColvilleComancheCosta RicanCreeCreekCroatianCrowCubanCypriotCzechCzechoslovakianDanishDelawareDominicanDutchDutch West IndianEastern EuropeanEcuadorianEgyptianEnglishEstonianEthiopianEuropeanFijianFilipinoFinnishFrenchFrench American IndianFrench CanadianGermanGerman RussianGhanaianGreekGuamanian/ChamorroGuatemalanGuyaneseHaitianHmongHonduranHopiHoumaHungarianIcelanderIndian (Asian)IndonesianInupiatIranianIraqiIrishIroquoisIsraeliItalianJamaicanJapaneseJordanianKenyanKiowaKoreanLaotianLatvianLebaneseLiberianLithuanianLumbeeLuxembourgerMacedonianMalaysianMalteseMarshalleseMenomineeMexicanMexican American IndianMongolianMoroccanNative HawaiianNavajoNepaleseNew ZealanderNicaraguanNigerianNorthern EuropeanNorwegianOkinawanOsageOttawaPaiutePakistaniPalestinianPanamanianParaguayanPennsylvania GermanPeruvianPimaPolishPortuguesePotawatomiPuebloPuerto RicanPuget Sound SalishRomanianRussianSalvadoranSamoanScandinavianScotch-IrishScottishSeminoleSenegaleseSerbianShoshoneSierra LeoneanSiouxSlavicSlovakSloveneSomaliSouth AfricanSouth AmericanSouth American IndianSoviet UnionSpaniardSpanishSpanish AmericanSpanish American IndianSri LankanSubsaharan AfricanSudaneseSwedishSwissSyrianTaiwaneseThaiTlingit-HaidaTohono O'OdhamTonganTrinidadian and TobagonianTsimshianTurkishU.S. Virgin IslanderUgandanUkrainianUruguayanVenezuelanVietnameseWelshWest IndianYakamaYaquiYugoslavianYumanYup'ikZimbabwean
Immigration
NonimmigrantsImmigrantsAfghanistanAfricaAlbaniaArgentinaArmeniaAsiaAustraliaAustriaBahamasBangladeshBarbadosBelarusBelgiumBelizeBoliviaBosnia and HerzegovinaBrazilBulgariaBurma/MyanmarCabo VerdeCambodiaCameroonCanadaCaribbeanCentral AmericaChileChinaColombiaCongoCosta RicaCroatiaCubaCzechoslovakiaDenmarkDominicaDominican RepublicEastern AfricaEastern AsiaEastern EuropeEcuadorEgyptEl SalvadorEnglandEritreaEthiopiaEuropeFijiFranceGermanyGhanaGreeceGrenadaGuatemalaGuyanaHaitiHondurasHong KongHungaryIndiaIndonesiaIranIraqIrelandIsraelItalyJamaicaJapanJordanKazakhstanKenyaKoreaKuwaitLaosLatin AmericaLatviaLebanonLiberiaLithuaniaMalaysiaMexicoMicronesiaMiddle AfricaMoldovaMoroccoNepalNetherlandsNicaraguaNigeriaNorth AmericaNorth MacedoniaNorthern AfricaNorthern EuropeNorwayOceaniaPakistanPanamaPeruPhilippinesPolandPortugalRomaniaRussiaSaudi ArabiaScotlandSenegalSerbiaSierra LeoneSingaporeSomaliaSouth AfricaSouth AmericaSouth Central AsiaSouth Eastern AsiaSouthern EuropeSpainSri LankaSt. Vincent and the GrenadinesSudanSwedenSwitzerlandSyriaTaiwanThailandTrinidad and TobagoTurkeyUgandaUkraineUruguayUzbekistanVenezuelaVietnamWest IndiesWestern AfricaWestern AsiaWestern EuropeYemenZaireZimbabweAzores
GED/Equivalency
Income
Poverty
Unemployment
Labor Participation
Family Structure
Vehicle Availability
Education Level
Disability

Ute GED/Equivalency
Tragic

81.8%
GED/EQUIVALENCY
0.0/ 100
METRIC RATING
298th/ 347
METRIC RANK

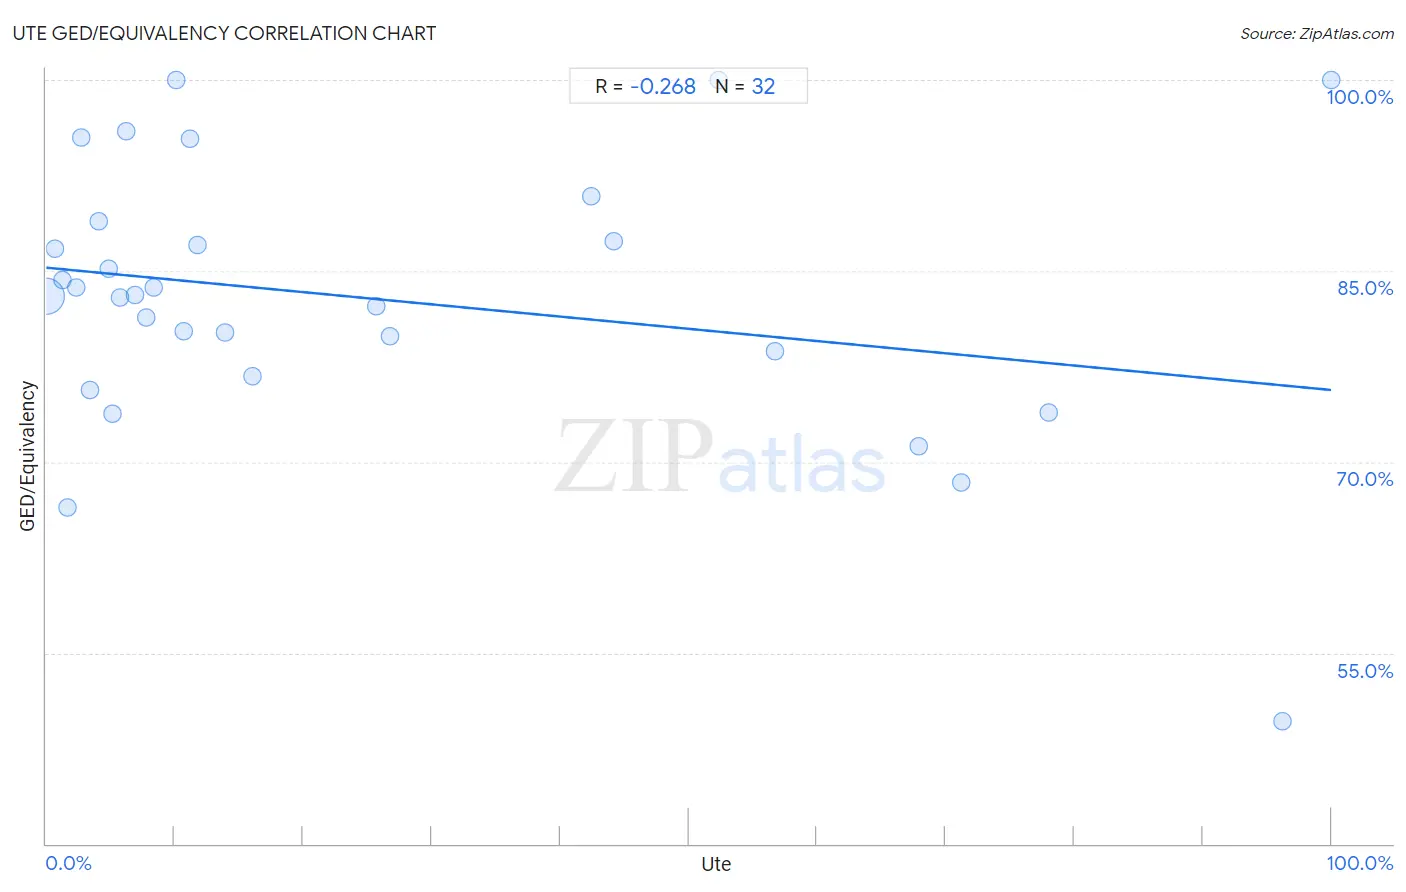
Ute GED/Equivalency Correlation Chart

The statistical analysis conducted on geographies consisting of 55,668,599 people shows a weak negative correlation between the proportion of Ute and percentage of population with at least ged/equivalency education in the United States with a correlation coefficient (R) of -0.268 and weighted average of 81.8%. On average, for every 1% (one percent) increase in Ute within a typical geography, there is a decrease of 0.096% in percentage of population with at least ged/equivalency education.
Ute GED/Equivalency
It is essential to understand that the correlation between the percentage of Ute and percentage of population with at least ged/equivalency education does not imply a direct cause-and-effect relationship. It remains uncertain whether the presence of Ute influences an upward or downward trend in the level of percentage of population with at least ged/equivalency education within an area, or if Ute simply ended up residing in those areas with higher or lower levels of percentage of population with at least ged/equivalency education due to other factors.

Demographics Similar to Ute by GED/Equivalency

In terms of ged/equivalency, the demographic groups most similar to Ute are Immigrants from Bangladesh (81.9%, a difference of 0.090%), Vietnamese (81.9%, a difference of 0.14%), Ecuadorian (81.7%, a difference of 0.14%), Nepalese (81.9%, a difference of 0.17%), and Fijian (81.6%, a difference of 0.20%).
DemographicsRating | RankGED/Equivalency
Cubans
0.0
/100
|
#291
Tragic
82.0%
Paiute
0.0
/100
|
#292
Tragic
82.0%
British West Indians
0.0
/100
|
#293
Tragic
82.0%
Immigrants from St. Vincent and the Grenadines
0.0
/100
|
#294
Tragic
82.0%
Nepalese
0.0
/100
|
#295
Tragic
81.9%
Vietnamese
0.0
/100
|
#296
Tragic
81.9%
Immigrants from Bangladesh
0.0
/100
|
#297
Tragic
81.9%
Ute
0.0
/100
|
#298
Tragic
81.8%
Ecuadorians
0.0
/100
|
#299
Tragic
81.7%
Fijians
0.0
/100
|
#300
Tragic
81.6%
Dutch West Indians
0.0
/100
|
#301
Tragic
81.6%
Immigrants from Haiti
0.0
/100
|
#302
Tragic
81.6%
Immigrants from Portugal
0.0
/100
|
#303
Tragic
81.6%
Navajo
0.0
/100
|
#304
Tragic
81.5%
Immigrants from Grenada
0.0
/100
|
#305
Tragic
81.3%

Ute GED/Equivalency Correlation Summary

MeasurementUte DataGED/Equivalency Data
Minimum0.028%49.6%
Maximum100.0%100.0%
Range100.0%50.4%
Mean24.9%82.9%
Median10.4%83.0%
Interquartile 25% (IQ1)4.5%77.7%
Interquartile 75% (IQ3)43.3%88.1%
Interquartile Range (IQR)38.8%10.4%
Standard Deviation (Sample)29.8%10.7%
Standard Deviation (Population)29.4%10.5%

Correlation Details

Ute PercentileSample SizeGED/Equivalency
[
0.0%
-
0.5%
]
0.028%
55,248,49583.0%
[
0.5%
-
1.0%
]
0.68%
249,34486.7%
[
1.0%
-
1.5%
]
1.22%
56,63584.3%
[
1.5%
-
2.0%
]
1.67%
10,15966.4%
[
2.0%
-
2.5%
]
2.33%
50,99883.7%
[
2.5%
-
3.0%
]
2.75%
8,45895.5%
[
3.0%
-
3.5%
]
3.36%
38775.7%
[
4.0%
-
4.5%
]
4.09%
2,00488.9%
[
4.5%
-
5.0%
]
4.86%
8,83085.2%
[
5.0%
-
5.5%
]
5.13%
1,15173.7%
[
5.5%
-
6.0%
]
5.71%
14,89482.9%
[
6.0%
-
6.5%
]
6.22%
49895.9%
[
6.5%
-
7.0%
]
6.87%
77183.1%
[
7.5%
-
8.0%
]
7.81%
1,75481.3%
[
8.0%
-
8.5%
]
8.33%
1,28583.7%
[
10.0%
-
10.5%
]
10.13%
158100.0%
[
10.5%
-
11.0%
]
10.75%
57780.3%
[
11.0%
-
11.5%
]
11.16%
48495.3%
[
11.5%
-
12.0%
]
11.76%
5,49587.1%
[
13.5%
-
14.0%
]
13.93%
24480.1%
[
16.0%
-
16.5%
]
16.07%
61676.7%
[
25.5%
-
26.0%
]
25.71%
14082.2%
[
26.5%
-
27.0%
]
26.77%
31079.9%
[
42.0%
-
42.5%
]
42.40%
28390.8%
[
44.0%
-
44.5%
]
44.12%
13687.4%
[
52.0%
-
52.5%
]
52.36%
191100.0%
[
56.5%
-
57.0%
]
56.67%
6078.7%
[
67.5%
-
68.0%
]
67.87%
83171.3%
[
71.0%
-
71.5%
]
71.25%
1,18668.4%
[
78.0%
-
78.5%
]
78.06%
1,69173.9%
[
96.0%
-
96.5%
]
96.19%
47249.6%
[
99.5%
-
100.0%
]
100.00%
62100.0%