Ute Wage/Income Gap
COMPARE
Ute
Select to Compare
Wage/Income Gap
Ute Wage/Income Gap
27.8%
WAGE/INCOME GAP
0.8/ 100
METRIC RATING
271st/ 347
METRIC RANK
Ute Wage/Income Gap Correlation Chart
The statistical analysis conducted on geographies consisting of 55,649,950 people shows a weak negative correlation between the proportion of Ute and wage/income gap percentage in the United States with a correlation coefficient (R) of -0.297 and weighted average of 27.8%. On average, for every 1% (one percent) increase in Ute within a typical geography, there is a decrease of 0.21% in wage/income gap percentage.
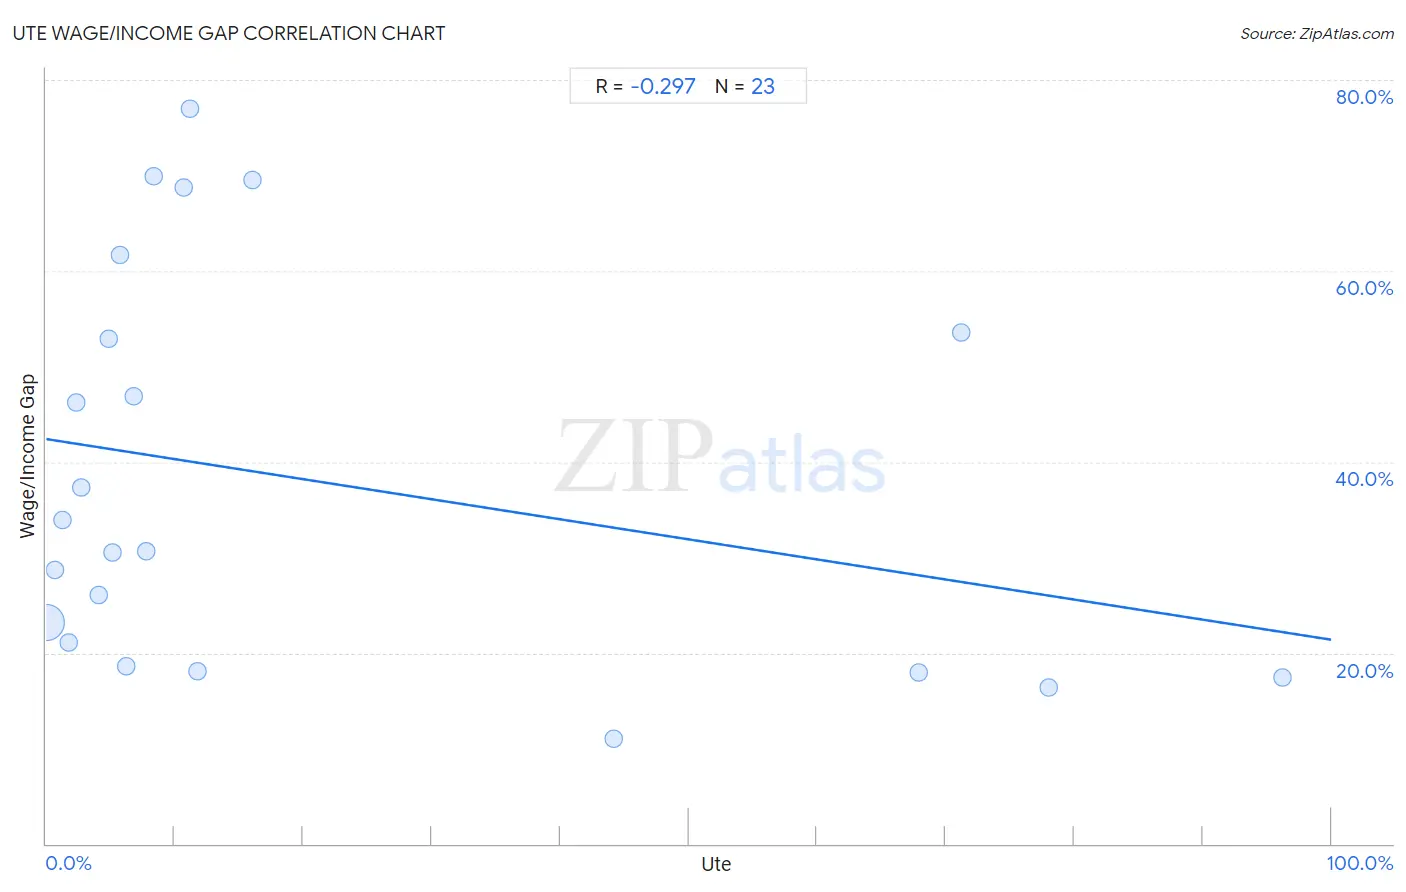
It is essential to understand that the correlation between the percentage of Ute and wage/income gap percentage does not imply a direct cause-and-effect relationship. It remains uncertain whether the presence of Ute influences an upward or downward trend in the level of wage/income gap percentage within an area, or if Ute simply ended up residing in those areas with higher or lower levels of wage/income gap percentage due to other factors.
Demographics Similar to Ute by Wage/Income Gap
In terms of wage/income gap, the demographic groups most similar to Ute are Immigrants from Korea (27.8%, a difference of 0.070%), Immigrants from Western Europe (27.8%, a difference of 0.080%), Bulgarian (27.8%, a difference of 0.18%), Potawatomi (27.7%, a difference of 0.20%), and New Zealander (27.7%, a difference of 0.21%).
| Demographics | Rating | Rank | Wage/Income Gap |
| Immigrants from Switzerland | 1.0 /100 | #264 | Tragic 27.7% |
| Serbians | 1.0 /100 | #265 | Tragic 27.7% |
| Hmong | 1.0 /100 | #266 | Tragic 27.7% |
| Turks | 1.0 /100 | #267 | Tragic 27.7% |
| New Zealanders | 1.0 /100 | #268 | Tragic 27.7% |
| Potawatomi | 0.9 /100 | #269 | Tragic 27.7% |
| Immigrants from Western Europe | 0.9 /100 | #270 | Tragic 27.8% |
| Ute | 0.8 /100 | #271 | Tragic 27.8% |
| Immigrants from Korea | 0.8 /100 | #272 | Tragic 27.8% |
| Bulgarians | 0.7 /100 | #273 | Tragic 27.8% |
| Americans | 0.7 /100 | #274 | Tragic 27.8% |
| Immigrants from Japan | 0.7 /100 | #275 | Tragic 27.9% |
| Lebanese | 0.7 /100 | #276 | Tragic 27.9% |
| Latvians | 0.7 /100 | #277 | Tragic 27.9% |
| Immigrants from England | 0.6 /100 | #278 | Tragic 27.9% |
Ute Wage/Income Gap Correlation Summary
| Measurement | Ute Data | Wage/Income Gap Data |
| Minimum | 0.028% | 11.0% |
| Maximum | 96.2% | 77.0% |
| Range | 96.2% | 66.0% |
| Mean | 20.2% | 38.1% |
| Median | 6.8% | 30.6% |
| Interquartile 25% (IQ1) | 2.8% | 18.6% |
| Interquartile 75% (IQ3) | 16.1% | 53.5% |
| Interquartile Range (IQR) | 13.3% | 34.9% |
| Standard Deviation (Sample) | 29.0% | 20.6% |
| Standard Deviation (Population) | 28.4% | 20.1% |
Correlation Details
| Ute Percentile | Sample Size | Wage/Income Gap |
[ 0.0% - 0.5% ] 0.028% | 55,241,179 | 23.2% |
[ 0.5% - 1.0% ] 0.68% | 245,748 | 28.6% |
[ 1.0% - 1.5% ] 1.22% | 56,400 | 33.9% |
[ 1.5% - 2.0% ] 1.73% | 7,165 | 21.1% |
[ 2.0% - 2.5% ] 2.33% | 49,404 | 46.3% |
[ 2.5% - 3.0% ] 2.75% | 8,458 | 37.3% |
[ 4.0% - 4.5% ] 4.06% | 1,674 | 26.0% |
[ 4.5% - 5.0% ] 4.86% | 8,830 | 52.9% |
[ 5.0% - 5.5% ] 5.13% | 1,151 | 30.5% |
[ 5.5% - 6.0% ] 5.71% | 14,538 | 61.6% |
[ 6.0% - 6.5% ] 6.22% | 498 | 18.6% |
[ 6.5% - 7.0% ] 6.81% | 470 | 46.8% |
[ 7.5% - 8.0% ] 7.81% | 1,754 | 30.6% |
[ 8.0% - 8.5% ] 8.33% | 1,285 | 70.0% |
[ 10.5% - 11.0% ] 10.72% | 485 | 68.8% |
[ 11.0% - 11.5% ] 11.16% | 484 | 77.0% |
[ 11.5% - 12.0% ] 11.76% | 5,495 | 18.0% |
[ 16.0% - 16.5% ] 16.07% | 616 | 69.6% |
[ 44.0% - 44.5% ] 44.12% | 136 | 11.0% |
[ 67.5% - 68.0% ] 67.87% | 831 | 17.9% |
[ 71.0% - 71.5% ] 71.25% | 1,186 | 53.5% |
[ 78.0% - 78.5% ] 78.06% | 1,691 | 16.4% |
[ 96.0% - 96.5% ] 96.19% | 472 | 17.4% |