Tohono O'odham 2 or more Vehicles in Household

COMPARE

Tohono O'odham
Race
Ancestry
AfghanAfricanAlaska NativeAlaskan AthabascanAlbanianAleutAlsatianAmericanApacheArabArapahoArgentineanArmenianAssyrian/Chaldean/SyriacAustralianAustrianBahamianBangladeshiBarbadianBasqueBelgianBelizeanBermudanBhutaneseBlackfeetBolivianBrazilianBritishBritish West IndianBulgarianBurmeseCajunCambodianCanadianCape VerdeanCarpatho RusynCelticCentral AmericanCentral American IndianCherokeeCheyenneChickasawChileanChineseChippewaChoctawColombianColvilleComancheCosta RicanCreeCreekCroatianCrowCubanCypriotCzechCzechoslovakianDanishDelawareDominicanDutchDutch West IndianEastern EuropeanEcuadorianEgyptianEnglishEstonianEthiopianEuropeanFijianFilipinoFinnishFrenchFrench American IndianFrench CanadianGermanGerman RussianGhanaianGreekGuamanian/ChamorroGuatemalanGuyaneseHaitianHmongHonduranHopiHoumaHungarianIcelanderIndian (Asian)IndonesianInupiatIranianIraqiIrishIroquoisIsraeliItalianJamaicanJapaneseJordanianKenyanKiowaKoreanLaotianLatvianLebaneseLiberianLithuanianLumbeeLuxembourgerMacedonianMalaysianMalteseMarshalleseMenomineeMexicanMexican American IndianMongolianMoroccanNative HawaiianNavajoNepaleseNew ZealanderNicaraguanNigerianNorthern EuropeanNorwegianOkinawanOsageOttawaPaiutePakistaniPalestinianPanamanianParaguayanPennsylvania GermanPeruvianPimaPolishPortuguesePotawatomiPuebloPuerto RicanPuget Sound SalishRomanianRussianSalvadoranSamoanScandinavianScotch-IrishScottishSeminoleSenegaleseSerbianShoshoneSierra LeoneanSiouxSlavicSlovakSloveneSomaliSouth AfricanSouth AmericanSouth American IndianSoviet UnionSpaniardSpanishSpanish AmericanSpanish American IndianSri LankanSubsaharan AfricanSudaneseSwedishSwissSyrianTaiwaneseThaiTlingit-HaidaTohono O'OdhamTonganTrinidadian and TobagonianTsimshianTurkishU.S. Virgin IslanderUgandanUkrainianUruguayanUteVenezuelanVietnameseWelshWest IndianYakamaYaquiYugoslavianYumanYup'ikZimbabwean
Immigration
NonimmigrantsImmigrantsAfghanistanAfricaAlbaniaArgentinaArmeniaAsiaAustraliaAustriaBahamasBangladeshBarbadosBelarusBelgiumBelizeBoliviaBosnia and HerzegovinaBrazilBulgariaBurma/MyanmarCabo VerdeCambodiaCameroonCanadaCaribbeanCentral AmericaChileChinaColombiaCongoCosta RicaCroatiaCubaCzechoslovakiaDenmarkDominicaDominican RepublicEastern AfricaEastern AsiaEastern EuropeEcuadorEgyptEl SalvadorEnglandEritreaEthiopiaEuropeFijiFranceGermanyGhanaGreeceGrenadaGuatemalaGuyanaHaitiHondurasHong KongHungaryIndiaIndonesiaIranIraqIrelandIsraelItalyJamaicaJapanJordanKazakhstanKenyaKoreaKuwaitLaosLatin AmericaLatviaLebanonLiberiaLithuaniaMalaysiaMexicoMicronesiaMiddle AfricaMoldovaMoroccoNepalNetherlandsNicaraguaNigeriaNorth AmericaNorth MacedoniaNorthern AfricaNorthern EuropeNorwayOceaniaPakistanPanamaPeruPhilippinesPolandPortugalRomaniaRussiaSaudi ArabiaScotlandSenegalSerbiaSierra LeoneSingaporeSomaliaSouth AfricaSouth AmericaSouth Central AsiaSouth Eastern AsiaSouthern EuropeSpainSri LankaSt. Vincent and the GrenadinesSudanSwedenSwitzerlandSyriaTaiwanThailandTrinidad and TobagoTurkeyUgandaUkraineUruguayUzbekistanVenezuelaVietnamWest IndiesWestern AfricaWestern AsiaWestern EuropeYemenZaireZimbabweAzores
Select to Compare
Race
Ancestry
AfghanAfricanAlaska NativeAlaskan AthabascanAlbanianAleutAlsatianAmericanApacheArabArapahoArgentineanArmenianAssyrian/Chaldean/SyriacAustralianAustrianBahamianBangladeshiBarbadianBasqueBelgianBelizeanBermudanBhutaneseBlackfeetBolivianBrazilianBritishBritish West IndianBulgarianBurmeseCajunCambodianCanadianCape VerdeanCarpatho RusynCelticCentral AmericanCentral American IndianCherokeeCheyenneChickasawChileanChineseChippewaChoctawColombianColvilleComancheCosta RicanCreeCreekCroatianCrowCubanCypriotCzechCzechoslovakianDanishDelawareDominicanDutchDutch West IndianEastern EuropeanEcuadorianEgyptianEnglishEstonianEthiopianEuropeanFijianFilipinoFinnishFrenchFrench American IndianFrench CanadianGermanGerman RussianGhanaianGreekGuamanian/ChamorroGuatemalanGuyaneseHaitianHmongHonduranHopiHoumaHungarianIcelanderIndian (Asian)IndonesianInupiatIranianIraqiIrishIroquoisIsraeliItalianJamaicanJapaneseJordanianKenyanKiowaKoreanLaotianLatvianLebaneseLiberianLithuanianLumbeeLuxembourgerMacedonianMalaysianMalteseMarshalleseMenomineeMexicanMexican American IndianMongolianMoroccanNative HawaiianNavajoNepaleseNew ZealanderNicaraguanNigerianNorthern EuropeanNorwegianOkinawanOsageOttawaPaiutePakistaniPalestinianPanamanianParaguayanPennsylvania GermanPeruvianPimaPolishPortuguesePotawatomiPuebloPuerto RicanPuget Sound SalishRomanianRussianSalvadoranSamoanScandinavianScotch-IrishScottishSeminoleSenegaleseSerbianShoshoneSierra LeoneanSiouxSlavicSlovakSloveneSomaliSouth AfricanSouth AmericanSouth American IndianSoviet UnionSpaniardSpanishSpanish AmericanSpanish American IndianSri LankanSubsaharan AfricanSudaneseSwedishSwissSyrianTaiwaneseThaiTlingit-HaidaTonganTrinidadian and TobagonianTsimshianTurkishU.S. Virgin IslanderUgandanUkrainianUruguayanUteVenezuelanVietnameseWelshWest IndianYakamaYaquiYugoslavianYumanYup'ikZimbabwean
Immigration
NonimmigrantsImmigrantsAfghanistanAfricaAlbaniaArgentinaArmeniaAsiaAustraliaAustriaBahamasBangladeshBarbadosBelarusBelgiumBelizeBoliviaBosnia and HerzegovinaBrazilBulgariaBurma/MyanmarCabo VerdeCambodiaCameroonCanadaCaribbeanCentral AmericaChileChinaColombiaCongoCosta RicaCroatiaCubaCzechoslovakiaDenmarkDominicaDominican RepublicEastern AfricaEastern AsiaEastern EuropeEcuadorEgyptEl SalvadorEnglandEritreaEthiopiaEuropeFijiFranceGermanyGhanaGreeceGrenadaGuatemalaGuyanaHaitiHondurasHong KongHungaryIndiaIndonesiaIranIraqIrelandIsraelItalyJamaicaJapanJordanKazakhstanKenyaKoreaKuwaitLaosLatin AmericaLatviaLebanonLiberiaLithuaniaMalaysiaMexicoMicronesiaMiddle AfricaMoldovaMoroccoNepalNetherlandsNicaraguaNigeriaNorth AmericaNorth MacedoniaNorthern AfricaNorthern EuropeNorwayOceaniaPakistanPanamaPeruPhilippinesPolandPortugalRomaniaRussiaSaudi ArabiaScotlandSenegalSerbiaSierra LeoneSingaporeSomaliaSouth AfricaSouth AmericaSouth Central AsiaSouth Eastern AsiaSouthern EuropeSpainSri LankaSt. Vincent and the GrenadinesSudanSwedenSwitzerlandSyriaTaiwanThailandTrinidad and TobagoTurkeyUgandaUkraineUruguayUzbekistanVenezuelaVietnamWest IndiesWestern AfricaWestern AsiaWestern EuropeYemenZaireZimbabweAzores
2 or more Vehicles in Household
Income
Poverty
Unemployment
Labor Participation
Family Structure
Vehicle Availability
Education Level
Disability

Tohono O'odham 2 or more Vehicles in Household
Tragic

50.0%
2+ VEHICLES AVAILABLE
0.0/ 100
METRIC RATING
303rd/ 347
METRIC RANK

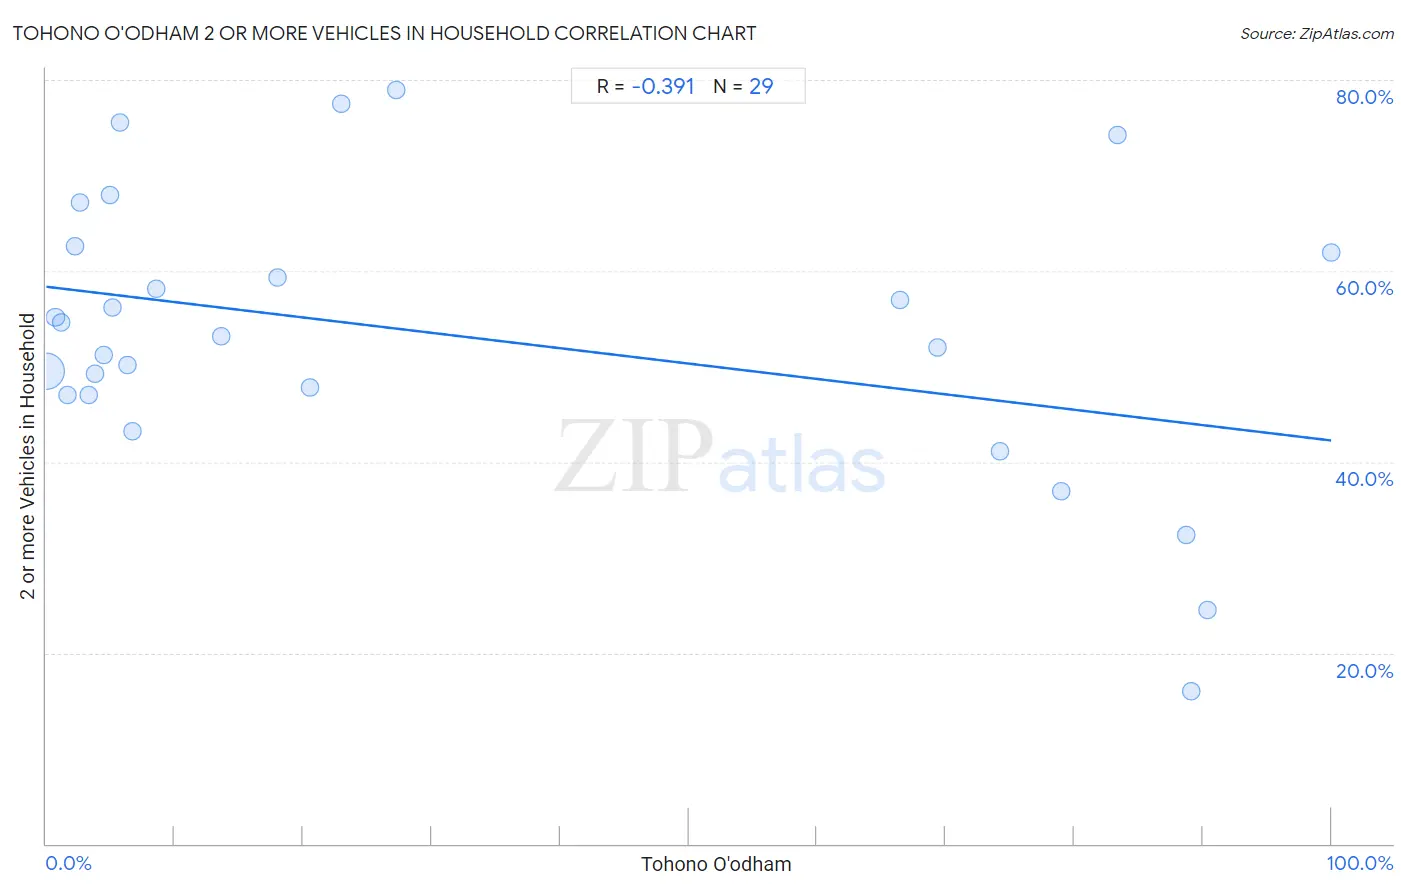
Tohono O'odham 2 or more Vehicles in Household Correlation Chart

The statistical analysis conducted on geographies consisting of 58,718,439 people shows a mild negative correlation between the proportion of Tohono O'odham and percentage of households with 2 or more vehicles available in the United States with a correlation coefficient (R) of -0.391 and weighted average of 50.0%. On average, for every 1% (one percent) increase in Tohono O'odham within a typical geography, there is a decrease of 0.16% in percentage of households with 2 or more vehicles available.
Tohono O'odham 2 or more Vehicles in Household
It is essential to understand that the correlation between the percentage of Tohono O'odham and percentage of households with 2 or more vehicles available does not imply a direct cause-and-effect relationship. It remains uncertain whether the presence of Tohono O'odham influences an upward or downward trend in the level of percentage of households with 2 or more vehicles available within an area, or if Tohono O'odham simply ended up residing in those areas with higher or lower levels of percentage of households with 2 or more vehicles available due to other factors.

Demographics Similar to Tohono O'odham by 2 or more Vehicles in Household

In terms of 2 or more vehicles in household, the demographic groups most similar to Tohono O'odham are Immigrants from Belize (49.9%, a difference of 0.20%), Immigrants from South America (50.2%, a difference of 0.37%), Immigrants from Greece (50.2%, a difference of 0.43%), Immigrants from Russia (50.3%, a difference of 0.62%), and Immigrants from Morocco (50.3%, a difference of 0.65%).
DemographicsRating | Rank2 or more Vehicles in Household
Immigrants from Somalia
0.0
/100
|
#296
Tragic
50.5%
Immigrants from Spain
0.0
/100
|
#297
Tragic
50.4%
Paraguayans
0.0
/100
|
#298
Tragic
50.3%
Immigrants from Morocco
0.0
/100
|
#299
Tragic
50.3%
Immigrants from Russia
0.0
/100
|
#300
Tragic
50.3%
Immigrants from Greece
0.0
/100
|
#301
Tragic
50.2%
Immigrants from South America
0.0
/100
|
#302
Tragic
50.2%
Tohono O'odham
0.0
/100
|
#303
Tragic
50.0%
Immigrants from Belize
0.0
/100
|
#304
Tragic
49.9%
Immigrants from Western Africa
0.0
/100
|
#305
Tragic
49.4%
Immigrants from Israel
0.0
/100
|
#306
Tragic
49.2%
Hopi
0.0
/100
|
#307
Tragic
49.0%
Albanians
0.0
/100
|
#308
Tragic
49.0%
Moroccans
0.0
/100
|
#309
Tragic
48.8%
Ghanaians
0.0
/100
|
#310
Tragic
48.0%

Tohono O'odham 2 or more Vehicles in Household Correlation Summary

MeasurementTohono O'odham Data2 or more Vehicles in Household Data
Minimum0.034%15.9%
Maximum100.0%79.0%
Range100.0%63.1%
Mean31.0%53.3%
Median8.6%53.2%
Interquartile 25% (IQ1)3.6%47.0%
Interquartile 75% (IQ3)71.8%62.2%
Interquartile Range (IQR)68.2%15.3%
Standard Deviation (Sample)36.1%14.9%
Standard Deviation (Population)35.4%14.6%

Correlation Details

Tohono O'odham PercentileSample Size2 or more Vehicles in Household
[
0.0%
-
0.5%
]
0.034%
56,790,80849.4%
[
0.5%
-
1.0%
]
0.71%
1,357,10855.1%
[
1.0%
-
1.5%
]
1.19%
386,79254.6%
[
1.5%
-
2.0%
]
1.66%
66,17147.0%
[
2.0%
-
2.5%
]
2.25%
11,96262.6%
[
2.5%
-
3.0%
]
2.63%
56,83267.2%
[
3.0%
-
3.5%
]
3.31%
7,51546.9%
[
3.5%
-
4.0%
]
3.81%
1,83549.3%
[
4.0%
-
4.5%
]
4.50%
1,17851.1%
[
4.5%
-
5.0%
]
4.93%
1,82468.0%
[
5.0%
-
5.5%
]
5.18%
96556.2%
[
5.5%
-
6.0%
]
5.77%
5,82075.5%
[
6.0%
-
6.5%
]
6.28%
73350.2%
[
6.5%
-
7.0%
]
6.68%
7,68543.2%
[
8.5%
-
9.0%
]
8.57%
2,40358.2%
[
13.5%
-
14.0%
]
13.66%
45453.2%
[
18.0%
-
18.5%
]
18.02%
39459.3%
[
20.5%
-
21.0%
]
20.52%
3,62147.7%
[
22.5%
-
23.0%
]
22.96%
39277.5%
[
27.0%
-
27.5%
]
27.26%
2,02179.0%
[
66.0%
-
66.5%
]
66.45%
91856.9%
[
69.0%
-
69.5%
]
69.32%
8852.0%
[
74.0%
-
74.5%
]
74.20%
31441.1%
[
78.5%
-
79.0%
]
78.94%
8,43436.9%
[
83.0%
-
83.5%
]
83.33%
20474.2%
[
88.5%
-
89.0%
]
88.67%
35332.4%
[
89.0%
-
89.5%
]
89.12%
88215.9%
[
90.0%
-
90.5%
]
90.37%
18724.4%
[
99.5%
-
100.0%
]
100.00%
54661.9%