Tohono O'odham Wage/Income Gap

COMPARE

Tohono O'odham
Race
Ancestry
AfghanAfricanAlaska NativeAlaskan AthabascanAlbanianAleutAlsatianAmericanApacheArabArapahoArgentineanArmenianAssyrian/Chaldean/SyriacAustralianAustrianBahamianBangladeshiBarbadianBasqueBelgianBelizeanBermudanBhutaneseBlackfeetBolivianBrazilianBritishBritish West IndianBulgarianBurmeseCajunCambodianCanadianCape VerdeanCarpatho RusynCelticCentral AmericanCentral American IndianCherokeeCheyenneChickasawChileanChineseChippewaChoctawColombianColvilleComancheCosta RicanCreeCreekCroatianCrowCubanCypriotCzechCzechoslovakianDanishDelawareDominicanDutchDutch West IndianEastern EuropeanEcuadorianEgyptianEnglishEstonianEthiopianEuropeanFijianFilipinoFinnishFrenchFrench American IndianFrench CanadianGermanGerman RussianGhanaianGreekGuamanian/ChamorroGuatemalanGuyaneseHaitianHmongHonduranHopiHoumaHungarianIcelanderIndian (Asian)IndonesianInupiatIranianIraqiIrishIroquoisIsraeliItalianJamaicanJapaneseJordanianKenyanKiowaKoreanLaotianLatvianLebaneseLiberianLithuanianLumbeeLuxembourgerMacedonianMalaysianMalteseMarshalleseMenomineeMexicanMexican American IndianMongolianMoroccanNative HawaiianNavajoNepaleseNew ZealanderNicaraguanNigerianNorthern EuropeanNorwegianOkinawanOsageOttawaPaiutePakistaniPalestinianPanamanianParaguayanPennsylvania GermanPeruvianPimaPolishPortuguesePotawatomiPuebloPuerto RicanPuget Sound SalishRomanianRussianSalvadoranSamoanScandinavianScotch-IrishScottishSeminoleSenegaleseSerbianShoshoneSierra LeoneanSiouxSlavicSlovakSloveneSomaliSouth AfricanSouth AmericanSouth American IndianSoviet UnionSpaniardSpanishSpanish AmericanSpanish American IndianSri LankanSubsaharan AfricanSudaneseSwedishSwissSyrianTaiwaneseThaiTlingit-HaidaTohono O'OdhamTonganTrinidadian and TobagonianTsimshianTurkishU.S. Virgin IslanderUgandanUkrainianUruguayanUteVenezuelanVietnameseWelshWest IndianYakamaYaquiYugoslavianYumanYup'ikZimbabwean
Immigration
NonimmigrantsImmigrantsAfghanistanAfricaAlbaniaArgentinaArmeniaAsiaAustraliaAustriaBahamasBangladeshBarbadosBelarusBelgiumBelizeBoliviaBosnia and HerzegovinaBrazilBulgariaBurma/MyanmarCabo VerdeCambodiaCameroonCanadaCaribbeanCentral AmericaChileChinaColombiaCongoCosta RicaCroatiaCubaCzechoslovakiaDenmarkDominicaDominican RepublicEastern AfricaEastern AsiaEastern EuropeEcuadorEgyptEl SalvadorEnglandEritreaEthiopiaEuropeFijiFranceGermanyGhanaGreeceGrenadaGuatemalaGuyanaHaitiHondurasHong KongHungaryIndiaIndonesiaIranIraqIrelandIsraelItalyJamaicaJapanJordanKazakhstanKenyaKoreaKuwaitLaosLatin AmericaLatviaLebanonLiberiaLithuaniaMalaysiaMexicoMicronesiaMiddle AfricaMoldovaMoroccoNepalNetherlandsNicaraguaNigeriaNorth AmericaNorth MacedoniaNorthern AfricaNorthern EuropeNorwayOceaniaPakistanPanamaPeruPhilippinesPolandPortugalRomaniaRussiaSaudi ArabiaScotlandSenegalSerbiaSierra LeoneSingaporeSomaliaSouth AfricaSouth AmericaSouth Central AsiaSouth Eastern AsiaSouthern EuropeSpainSri LankaSt. Vincent and the GrenadinesSudanSwedenSwitzerlandSyriaTaiwanThailandTrinidad and TobagoTurkeyUgandaUkraineUruguayUzbekistanVenezuelaVietnamWest IndiesWestern AfricaWestern AsiaWestern EuropeYemenZaireZimbabweAzores
Select to Compare
Race
Ancestry
AfghanAfricanAlaska NativeAlaskan AthabascanAlbanianAleutAlsatianAmericanApacheArabArapahoArgentineanArmenianAssyrian/Chaldean/SyriacAustralianAustrianBahamianBangladeshiBarbadianBasqueBelgianBelizeanBermudanBhutaneseBlackfeetBolivianBrazilianBritishBritish West IndianBulgarianBurmeseCajunCambodianCanadianCape VerdeanCarpatho RusynCelticCentral AmericanCentral American IndianCherokeeCheyenneChickasawChileanChineseChippewaChoctawColombianColvilleComancheCosta RicanCreeCreekCroatianCrowCubanCypriotCzechCzechoslovakianDanishDelawareDominicanDutchDutch West IndianEastern EuropeanEcuadorianEgyptianEnglishEstonianEthiopianEuropeanFijianFilipinoFinnishFrenchFrench American IndianFrench CanadianGermanGerman RussianGhanaianGreekGuamanian/ChamorroGuatemalanGuyaneseHaitianHmongHonduranHopiHoumaHungarianIcelanderIndian (Asian)IndonesianInupiatIranianIraqiIrishIroquoisIsraeliItalianJamaicanJapaneseJordanianKenyanKiowaKoreanLaotianLatvianLebaneseLiberianLithuanianLumbeeLuxembourgerMacedonianMalaysianMalteseMarshalleseMenomineeMexicanMexican American IndianMongolianMoroccanNative HawaiianNavajoNepaleseNew ZealanderNicaraguanNigerianNorthern EuropeanNorwegianOkinawanOsageOttawaPaiutePakistaniPalestinianPanamanianParaguayanPennsylvania GermanPeruvianPimaPolishPortuguesePotawatomiPuebloPuerto RicanPuget Sound SalishRomanianRussianSalvadoranSamoanScandinavianScotch-IrishScottishSeminoleSenegaleseSerbianShoshoneSierra LeoneanSiouxSlavicSlovakSloveneSomaliSouth AfricanSouth AmericanSouth American IndianSoviet UnionSpaniardSpanishSpanish AmericanSpanish American IndianSri LankanSubsaharan AfricanSudaneseSwedishSwissSyrianTaiwaneseThaiTlingit-HaidaTonganTrinidadian and TobagonianTsimshianTurkishU.S. Virgin IslanderUgandanUkrainianUruguayanUteVenezuelanVietnameseWelshWest IndianYakamaYaquiYugoslavianYumanYup'ikZimbabwean
Immigration
NonimmigrantsImmigrantsAfghanistanAfricaAlbaniaArgentinaArmeniaAsiaAustraliaAustriaBahamasBangladeshBarbadosBelarusBelgiumBelizeBoliviaBosnia and HerzegovinaBrazilBulgariaBurma/MyanmarCabo VerdeCambodiaCameroonCanadaCaribbeanCentral AmericaChileChinaColombiaCongoCosta RicaCroatiaCubaCzechoslovakiaDenmarkDominicaDominican RepublicEastern AfricaEastern AsiaEastern EuropeEcuadorEgyptEl SalvadorEnglandEritreaEthiopiaEuropeFijiFranceGermanyGhanaGreeceGrenadaGuatemalaGuyanaHaitiHondurasHong KongHungaryIndiaIndonesiaIranIraqIrelandIsraelItalyJamaicaJapanJordanKazakhstanKenyaKoreaKuwaitLaosLatin AmericaLatviaLebanonLiberiaLithuaniaMalaysiaMexicoMicronesiaMiddle AfricaMoldovaMoroccoNepalNetherlandsNicaraguaNigeriaNorth AmericaNorth MacedoniaNorthern AfricaNorthern EuropeNorwayOceaniaPakistanPanamaPeruPhilippinesPolandPortugalRomaniaRussiaSaudi ArabiaScotlandSenegalSerbiaSierra LeoneSingaporeSomaliaSouth AfricaSouth AmericaSouth Central AsiaSouth Eastern AsiaSouthern EuropeSpainSri LankaSt. Vincent and the GrenadinesSudanSwedenSwitzerlandSyriaTaiwanThailandTrinidad and TobagoTurkeyUgandaUkraineUruguayUzbekistanVenezuelaVietnamWest IndiesWestern AfricaWestern AsiaWestern EuropeYemenZaireZimbabweAzores
Wage/Income Gap
Income
Poverty
Unemployment
Labor Participation
Family Structure
Vehicle Availability
Education Level
Disability

Tohono O'odham Wage/Income Gap
Exceptional

22.1%
WAGE/INCOME GAP
100.0/ 100
METRIC RATING
51st/ 347
METRIC RANK

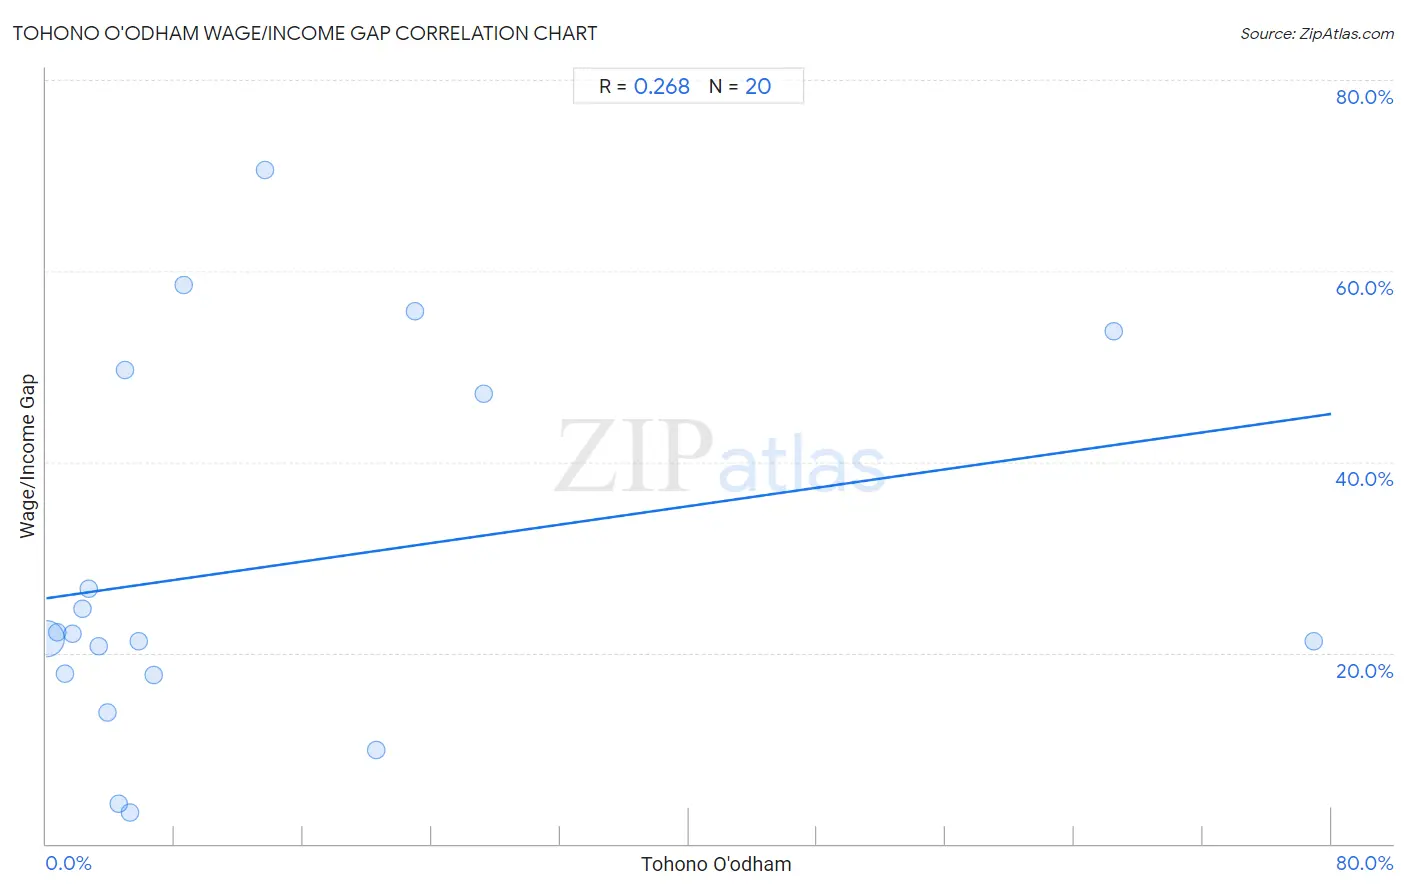
Tohono O'odham Wage/Income Gap Correlation Chart

The statistical analysis conducted on geographies consisting of 58,710,489 people shows a weak positive correlation between the proportion of Tohono O'odham and wage/income gap percentage in the United States with a correlation coefficient (R) of 0.268 and weighted average of 22.1%. On average, for every 1% (one percent) increase in Tohono O'odham within a typical geography, there is an increase of 0.24% in wage/income gap percentage.
Tohono O'odham Wage/Income Gap
It is essential to understand that the correlation between the percentage of Tohono O'odham and wage/income gap percentage does not imply a direct cause-and-effect relationship. It remains uncertain whether the presence of Tohono O'odham influences an upward or downward trend in the level of wage/income gap percentage within an area, or if Tohono O'odham simply ended up residing in those areas with higher or lower levels of wage/income gap percentage due to other factors.

Demographics Similar to Tohono O'odham by Wage/Income Gap

In terms of wage/income gap, the demographic groups most similar to Tohono O'odham are Immigrants from Cameroon (22.2%, a difference of 0.080%), Bangladeshi (22.2%, a difference of 0.10%), Nepalese (22.2%, a difference of 0.32%), Immigrants from Western Africa (22.0%, a difference of 0.44%), and Immigrants from Zaire (22.3%, a difference of 0.72%).
DemographicsRating | RankWage/Income Gap
Immigrants from Eritrea
100.0
/100
|
#44
Exceptional
21.4%
U.S. Virgin Islanders
100.0
/100
|
#45
Exceptional
21.5%
Immigrants from Ethiopia
100.0
/100
|
#46
Exceptional
21.6%
Immigrants from Congo
100.0
/100
|
#47
Exceptional
21.7%
Blacks/African Americans
100.0
/100
|
#48
Exceptional
21.7%
Ethiopians
100.0
/100
|
#49
Exceptional
21.8%
Immigrants from Western Africa
100.0
/100
|
#50
Exceptional
22.0%
Tohono O'odham
100.0
/100
|
#51
Exceptional
22.1%
Immigrants from Cameroon
100.0
/100
|
#52
Exceptional
22.2%
Bangladeshis
100.0
/100
|
#53
Exceptional
22.2%
Nepalese
100.0
/100
|
#54
Exceptional
22.2%
Immigrants from Zaire
100.0
/100
|
#55
Exceptional
22.3%
Immigrants from Ghana
100.0
/100
|
#56
Exceptional
22.3%
Ghanaians
100.0
/100
|
#57
Exceptional
22.3%
Immigrants from Cuba
100.0
/100
|
#58
Exceptional
22.4%

Tohono O'odham Wage/Income Gap Correlation Summary

MeasurementTohono O'odham DataWage/Income Gap Data
Minimum0.034%3.3%
Maximum78.9%70.6%
Range78.9%67.3%
Mean14.1%29.1%
Median5.1%21.8%
Interquartile 25% (IQ1)2.4%17.8%
Interquartile 75% (IQ3)17.1%48.4%
Interquartile Range (IQR)14.6%30.7%
Standard Deviation (Sample)21.6%19.4%
Standard Deviation (Population)21.0%19.0%

Correlation Details

Tohono O'odham PercentileSample SizeWage/Income Gap
[
0.0%
-
0.5%
]
0.034%
56,790,52521.5%
[
0.5%
-
1.0%
]
0.71%
1,355,63722.2%
[
1.0%
-
1.5%
]
1.19%
386,04217.8%
[
1.5%
-
2.0%
]
1.66%
65,06322.0%
[
2.0%
-
2.5%
]
2.25%
11,96224.6%
[
2.5%
-
3.0%
]
2.63%
56,83226.7%
[
3.0%
-
3.5%
]
3.31%
7,04720.7%
[
3.5%
-
4.0%
]
3.81%
1,83513.7%
[
4.0%
-
4.5%
]
4.50%
1,1784.1%
[
4.5%
-
5.0%
]
4.93%
1,82449.7%
[
5.0%
-
5.5%
]
5.18%
9653.3%
[
5.5%
-
6.0%
]
5.77%
5,82021.2%
[
6.5%
-
7.0%
]
6.68%
7,68517.7%
[
8.5%
-
9.0%
]
8.57%
2,40358.5%
[
13.5%
-
14.0%
]
13.66%
45470.6%
[
20.5%
-
21.0%
]
20.52%
3,6219.8%
[
22.5%
-
23.0%
]
22.96%
39255.8%
[
27.0%
-
27.5%
]
27.26%
2,02147.2%
[
66.0%
-
66.5%
]
66.49%
74953.6%
[
78.5%
-
79.0%
]
78.94%
8,43421.2%