Tohono O'odham Disability
COMPARE
Tohono O'odham
Select to Compare
Disability
Tohono O'odham Disability
14.8%
DISABILITY
0.0/ 100
METRIC RATING
335th/ 347
METRIC RANK
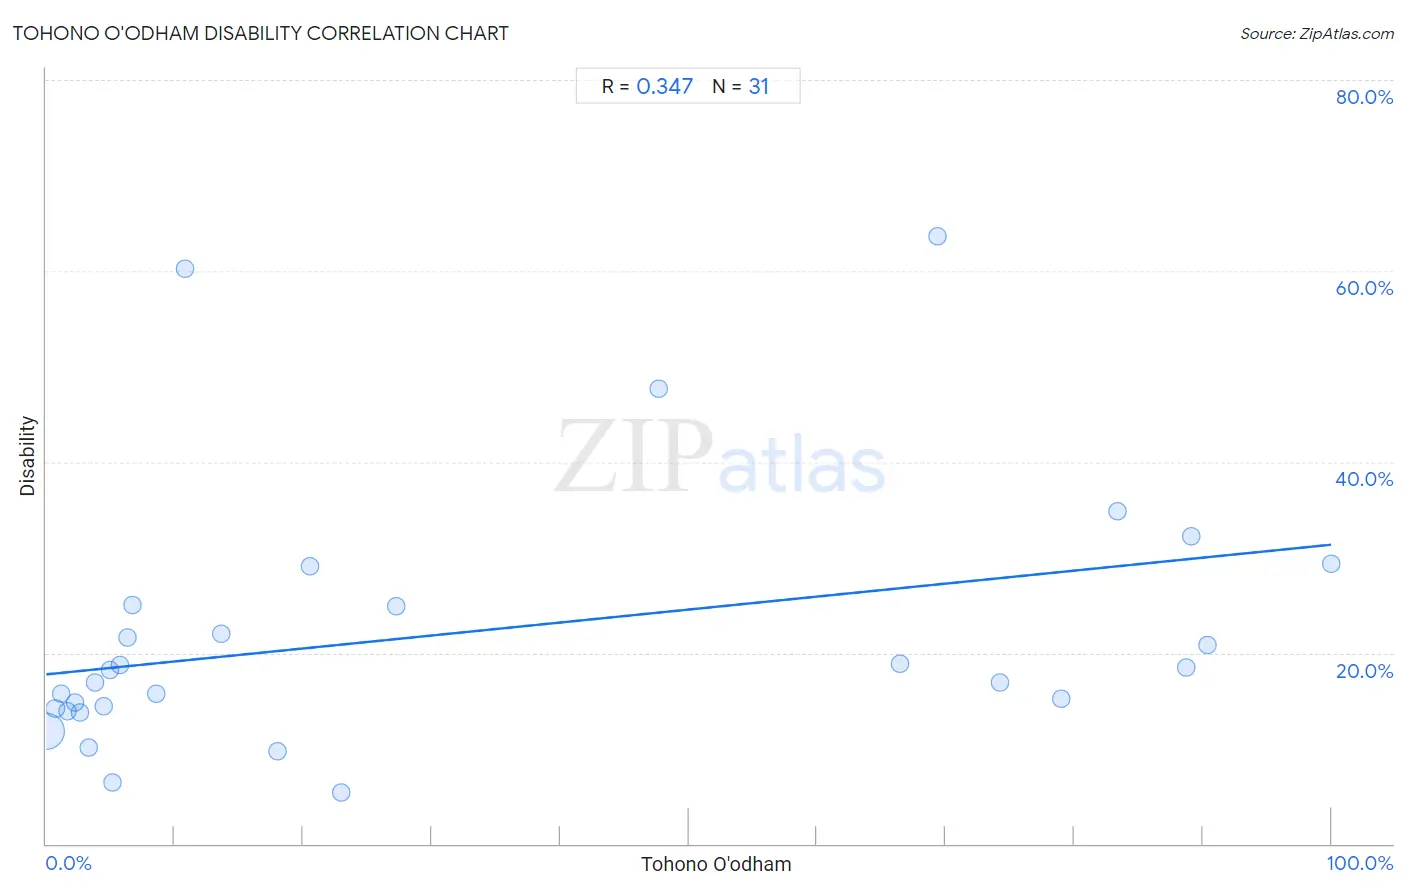
Tohono O'odham Disability Correlation Chart
The statistical analysis conducted on geographies consisting of 58,721,793 people shows a mild positive correlation between the proportion of Tohono O'odham and percentage of population with a disability in the United States with a correlation coefficient (R) of 0.347 and weighted average of 14.8%. On average, for every 1% (one percent) increase in Tohono O'odham within a typical geography, there is an increase of 0.14% in percentage of population with a disability.
It is essential to understand that the correlation between the percentage of Tohono O'odham and percentage of population with a disability does not imply a direct cause-and-effect relationship. It remains uncertain whether the presence of Tohono O'odham influences an upward or downward trend in the level of percentage of population with a disability within an area, or if Tohono O'odham simply ended up residing in those areas with higher or lower levels of percentage of population with a disability due to other factors.
Demographics Similar to Tohono O'odham by Disability
In terms of disability, the demographic groups most similar to Tohono O'odham are Cherokee (14.8%, a difference of 0.51%), Seminole (14.9%, a difference of 0.61%), Dutch West Indian (14.9%, a difference of 0.91%), Yuman (14.6%, a difference of 1.0%), and Cajun (14.6%, a difference of 1.2%).
| Demographics | Rating | Rank | Disability |
| Immigrants from the Azores | 0.0 /100 | #328 | Tragic 14.2% |
| Potawatomi | 0.0 /100 | #329 | Tragic 14.2% |
| Navajo | 0.0 /100 | #330 | Tragic 14.3% |
| Alaskan Athabascans | 0.0 /100 | #331 | Tragic 14.4% |
| Pueblo | 0.0 /100 | #332 | Tragic 14.4% |
| Cajuns | 0.0 /100 | #333 | Tragic 14.6% |
| Yuman | 0.0 /100 | #334 | Tragic 14.6% |
| Tohono O'odham | 0.0 /100 | #335 | Tragic 14.8% |
| Cherokee | 0.0 /100 | #336 | Tragic 14.8% |
| Seminole | 0.0 /100 | #337 | Tragic 14.9% |
| Dutch West Indians | 0.0 /100 | #338 | Tragic 14.9% |
| Chickasaw | 0.0 /100 | #339 | Tragic 15.2% |
| Choctaw | 0.0 /100 | #340 | Tragic 15.4% |
| Lumbee | 0.0 /100 | #341 | Tragic 15.5% |
| Kiowa | 0.0 /100 | #342 | Tragic 15.6% |
Tohono O'odham Disability Correlation Summary
| Measurement | Tohono O'odham Data | Disability Data |
| Minimum | 0.034% | 5.4% |
| Maximum | 100.0% | 63.6% |
| Range | 100.0% | 58.3% |
| Mean | 30.9% | 21.9% |
| Median | 10.8% | 18.2% |
| Interquartile 25% (IQ1) | 3.8% | 14.1% |
| Interquartile 75% (IQ3) | 69.3% | 25.0% |
| Interquartile Range (IQR) | 65.5% | 10.9% |
| Standard Deviation (Sample) | 35.2% | 13.8% |
| Standard Deviation (Population) | 34.6% | 13.5% |
Correlation Details
| Tohono O'odham Percentile | Sample Size | Disability |
[ 0.0% - 0.5% ] 0.034% | 56,793,757 | 11.7% |
[ 0.5% - 1.0% ] 0.71% | 1,357,108 | 14.1% |
[ 1.0% - 1.5% ] 1.19% | 386,792 | 15.7% |
[ 1.5% - 2.0% ] 1.66% | 66,171 | 13.9% |
[ 2.0% - 2.5% ] 2.25% | 11,962 | 14.8% |
[ 2.5% - 3.0% ] 2.63% | 56,832 | 13.8% |
[ 3.0% - 3.5% ] 3.31% | 7,515 | 10.1% |
[ 3.5% - 4.0% ] 3.81% | 1,835 | 16.9% |
[ 4.0% - 4.5% ] 4.50% | 1,178 | 14.4% |
[ 4.5% - 5.0% ] 4.93% | 1,824 | 18.2% |
[ 5.0% - 5.5% ] 5.18% | 965 | 6.4% |
[ 5.5% - 6.0% ] 5.77% | 5,820 | 18.7% |
[ 6.0% - 6.5% ] 6.28% | 733 | 21.6% |
[ 6.5% - 7.0% ] 6.68% | 7,685 | 25.0% |
[ 8.5% - 9.0% ] 8.57% | 2,403 | 15.7% |
[ 10.5% - 11.0% ] 10.81% | 148 | 60.2% |
[ 13.5% - 14.0% ] 13.66% | 454 | 22.0% |
[ 18.0% - 18.5% ] 18.02% | 394 | 9.6% |
[ 20.5% - 21.0% ] 20.52% | 3,621 | 29.1% |
[ 22.5% - 23.0% ] 22.96% | 392 | 5.4% |
[ 27.0% - 27.5% ] 27.26% | 2,021 | 24.9% |
[ 47.5% - 48.0% ] 47.62% | 21 | 47.6% |
[ 66.0% - 66.5% ] 66.45% | 918 | 18.8% |
[ 69.0% - 69.5% ] 69.32% | 88 | 63.6% |
[ 74.0% - 74.5% ] 74.20% | 314 | 16.9% |
[ 78.5% - 79.0% ] 78.94% | 8,434 | 15.2% |
[ 83.0% - 83.5% ] 83.33% | 204 | 34.8% |
[ 88.5% - 89.0% ] 88.67% | 353 | 18.4% |
[ 89.0% - 89.5% ] 89.12% | 882 | 32.2% |
[ 90.0% - 90.5% ] 90.37% | 187 | 20.9% |
[ 99.5% - 100.0% ] 100.00% | 782 | 29.3% |