Tohono O'odham Married-Couple Family Poverty

COMPARE

Tohono O'odham
Race
Ancestry
AfghanAfricanAlaska NativeAlaskan AthabascanAlbanianAleutAlsatianAmericanApacheArabArapahoArgentineanArmenianAssyrian/Chaldean/SyriacAustralianAustrianBahamianBangladeshiBarbadianBasqueBelgianBelizeanBermudanBhutaneseBlackfeetBolivianBrazilianBritishBritish West IndianBulgarianBurmeseCajunCambodianCanadianCape VerdeanCarpatho RusynCelticCentral AmericanCentral American IndianCherokeeCheyenneChickasawChileanChineseChippewaChoctawColombianColvilleComancheCosta RicanCreeCreekCroatianCrowCubanCypriotCzechCzechoslovakianDanishDelawareDominicanDutchDutch West IndianEastern EuropeanEcuadorianEgyptianEnglishEstonianEthiopianEuropeanFijianFilipinoFinnishFrenchFrench American IndianFrench CanadianGermanGerman RussianGhanaianGreekGuamanian/ChamorroGuatemalanGuyaneseHaitianHmongHonduranHopiHoumaHungarianIcelanderIndian (Asian)IndonesianInupiatIranianIraqiIrishIroquoisIsraeliItalianJamaicanJapaneseJordanianKenyanKiowaKoreanLaotianLatvianLebaneseLiberianLithuanianLumbeeLuxembourgerMacedonianMalaysianMalteseMarshalleseMenomineeMexicanMexican American IndianMongolianMoroccanNative HawaiianNavajoNepaleseNew ZealanderNicaraguanNigerianNorthern EuropeanNorwegianOkinawanOsageOttawaPaiutePakistaniPalestinianPanamanianParaguayanPennsylvania GermanPeruvianPimaPolishPortuguesePotawatomiPuebloPuerto RicanPuget Sound SalishRomanianRussianSalvadoranSamoanScandinavianScotch-IrishScottishSeminoleSenegaleseSerbianShoshoneSierra LeoneanSiouxSlavicSlovakSloveneSomaliSouth AfricanSouth AmericanSouth American IndianSoviet UnionSpaniardSpanishSpanish AmericanSpanish American IndianSri LankanSubsaharan AfricanSudaneseSwedishSwissSyrianTaiwaneseThaiTlingit-HaidaTohono O'OdhamTonganTrinidadian and TobagonianTsimshianTurkishU.S. Virgin IslanderUgandanUkrainianUruguayanUteVenezuelanVietnameseWelshWest IndianYakamaYaquiYugoslavianYumanYup'ikZimbabwean
Immigration
NonimmigrantsImmigrantsAfghanistanAfricaAlbaniaArgentinaArmeniaAsiaAustraliaAustriaBahamasBangladeshBarbadosBelarusBelgiumBelizeBoliviaBosnia and HerzegovinaBrazilBulgariaBurma/MyanmarCabo VerdeCambodiaCameroonCanadaCaribbeanCentral AmericaChileChinaColombiaCongoCosta RicaCroatiaCubaCzechoslovakiaDenmarkDominicaDominican RepublicEastern AfricaEastern AsiaEastern EuropeEcuadorEgyptEl SalvadorEnglandEritreaEthiopiaEuropeFijiFranceGermanyGhanaGreeceGrenadaGuatemalaGuyanaHaitiHondurasHong KongHungaryIndiaIndonesiaIranIraqIrelandIsraelItalyJamaicaJapanJordanKazakhstanKenyaKoreaKuwaitLaosLatin AmericaLatviaLebanonLiberiaLithuaniaMalaysiaMexicoMicronesiaMiddle AfricaMoldovaMoroccoNepalNetherlandsNicaraguaNigeriaNorth AmericaNorth MacedoniaNorthern AfricaNorthern EuropeNorwayOceaniaPakistanPanamaPeruPhilippinesPolandPortugalRomaniaRussiaSaudi ArabiaScotlandSenegalSerbiaSierra LeoneSingaporeSomaliaSouth AfricaSouth AmericaSouth Central AsiaSouth Eastern AsiaSouthern EuropeSpainSri LankaSt. Vincent and the GrenadinesSudanSwedenSwitzerlandSyriaTaiwanThailandTrinidad and TobagoTurkeyUgandaUkraineUruguayUzbekistanVenezuelaVietnamWest IndiesWestern AfricaWestern AsiaWestern EuropeYemenZaireZimbabweAzores
Select to Compare
Race
Ancestry
AfghanAfricanAlaska NativeAlaskan AthabascanAlbanianAleutAlsatianAmericanApacheArabArapahoArgentineanArmenianAssyrian/Chaldean/SyriacAustralianAustrianBahamianBangladeshiBarbadianBasqueBelgianBelizeanBermudanBhutaneseBlackfeetBolivianBrazilianBritishBritish West IndianBulgarianBurmeseCajunCambodianCanadianCape VerdeanCarpatho RusynCelticCentral AmericanCentral American IndianCherokeeCheyenneChickasawChileanChineseChippewaChoctawColombianColvilleComancheCosta RicanCreeCreekCroatianCrowCubanCypriotCzechCzechoslovakianDanishDelawareDominicanDutchDutch West IndianEastern EuropeanEcuadorianEgyptianEnglishEstonianEthiopianEuropeanFijianFilipinoFinnishFrenchFrench American IndianFrench CanadianGermanGerman RussianGhanaianGreekGuamanian/ChamorroGuatemalanGuyaneseHaitianHmongHonduranHopiHoumaHungarianIcelanderIndian (Asian)IndonesianInupiatIranianIraqiIrishIroquoisIsraeliItalianJamaicanJapaneseJordanianKenyanKiowaKoreanLaotianLatvianLebaneseLiberianLithuanianLumbeeLuxembourgerMacedonianMalaysianMalteseMarshalleseMenomineeMexicanMexican American IndianMongolianMoroccanNative HawaiianNavajoNepaleseNew ZealanderNicaraguanNigerianNorthern EuropeanNorwegianOkinawanOsageOttawaPaiutePakistaniPalestinianPanamanianParaguayanPennsylvania GermanPeruvianPimaPolishPortuguesePotawatomiPuebloPuerto RicanPuget Sound SalishRomanianRussianSalvadoranSamoanScandinavianScotch-IrishScottishSeminoleSenegaleseSerbianShoshoneSierra LeoneanSiouxSlavicSlovakSloveneSomaliSouth AfricanSouth AmericanSouth American IndianSoviet UnionSpaniardSpanishSpanish AmericanSpanish American IndianSri LankanSubsaharan AfricanSudaneseSwedishSwissSyrianTaiwaneseThaiTlingit-HaidaTonganTrinidadian and TobagonianTsimshianTurkishU.S. Virgin IslanderUgandanUkrainianUruguayanUteVenezuelanVietnameseWelshWest IndianYakamaYaquiYugoslavianYumanYup'ikZimbabwean
Immigration
NonimmigrantsImmigrantsAfghanistanAfricaAlbaniaArgentinaArmeniaAsiaAustraliaAustriaBahamasBangladeshBarbadosBelarusBelgiumBelizeBoliviaBosnia and HerzegovinaBrazilBulgariaBurma/MyanmarCabo VerdeCambodiaCameroonCanadaCaribbeanCentral AmericaChileChinaColombiaCongoCosta RicaCroatiaCubaCzechoslovakiaDenmarkDominicaDominican RepublicEastern AfricaEastern AsiaEastern EuropeEcuadorEgyptEl SalvadorEnglandEritreaEthiopiaEuropeFijiFranceGermanyGhanaGreeceGrenadaGuatemalaGuyanaHaitiHondurasHong KongHungaryIndiaIndonesiaIranIraqIrelandIsraelItalyJamaicaJapanJordanKazakhstanKenyaKoreaKuwaitLaosLatin AmericaLatviaLebanonLiberiaLithuaniaMalaysiaMexicoMicronesiaMiddle AfricaMoldovaMoroccoNepalNetherlandsNicaraguaNigeriaNorth AmericaNorth MacedoniaNorthern AfricaNorthern EuropeNorwayOceaniaPakistanPanamaPeruPhilippinesPolandPortugalRomaniaRussiaSaudi ArabiaScotlandSenegalSerbiaSierra LeoneSingaporeSomaliaSouth AfricaSouth AmericaSouth Central AsiaSouth Eastern AsiaSouthern EuropeSpainSri LankaSt. Vincent and the GrenadinesSudanSwedenSwitzerlandSyriaTaiwanThailandTrinidad and TobagoTurkeyUgandaUkraineUruguayUzbekistanVenezuelaVietnamWest IndiesWestern AfricaWestern AsiaWestern EuropeYemenZaireZimbabweAzores
Married-Couple Family Poverty
Income
Poverty
Unemployment
Labor Participation
Family Structure
Vehicle Availability
Education Level
Disability

Tohono O'odham Married-Couple Family Poverty
Tragic

11.2%
POVERTY | MARRIED-COUPLE FAMILIES
0.0/ 100
METRIC RATING
342nd/ 347
METRIC RANK

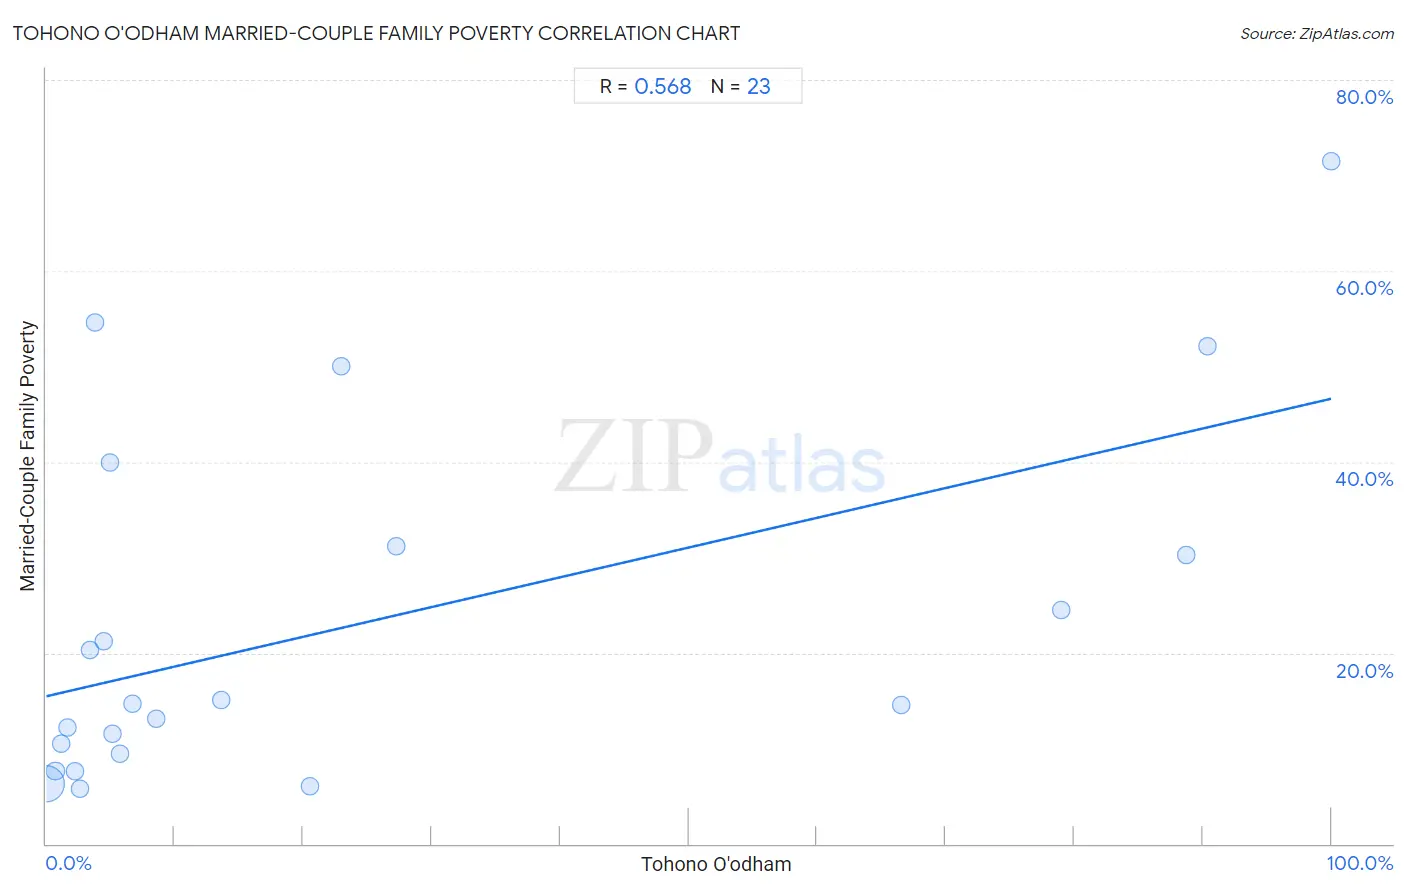
Tohono O'odham Married-Couple Family Poverty Correlation Chart

The statistical analysis conducted on geographies consisting of 58,693,710 people shows a substantial positive correlation between the proportion of Tohono O'odham and poverty level among married-couple families in the United States with a correlation coefficient (R) of 0.568 and weighted average of 11.2%. On average, for every 1% (one percent) increase in Tohono O'odham within a typical geography, there is an increase of 0.31% in poverty level among married-couple families.
Tohono O'odham Married-Couple Family Poverty
It is essential to understand that the correlation between the percentage of Tohono O'odham and poverty level among married-couple families does not imply a direct cause-and-effect relationship. It remains uncertain whether the presence of Tohono O'odham influences an upward or downward trend in the level of poverty level among married-couple families within an area, or if Tohono O'odham simply ended up residing in those areas with higher or lower levels of poverty level among married-couple families due to other factors.

Demographics Similar to Tohono O'odham by Married-Couple Family Poverty

In terms of married-couple family poverty, the demographic groups most similar to Tohono O'odham are Pueblo (11.1%, a difference of 0.93%), Pima (11.4%, a difference of 1.7%), Navajo (11.9%, a difference of 5.6%), Puerto Rican (12.6%, a difference of 12.6%), and Immigrants from Yemen (12.8%, a difference of 14.1%).
DemographicsRating | RankMarried-Couple Family Poverty
Lumbee
0.0
/100
|
#333
Tragic
8.3%
Immigrants from Dominican Republic
0.0
/100
|
#334
Tragic
8.4%
Sioux
0.0
/100
|
#335
Tragic
8.7%
Apache
0.0
/100
|
#336
Tragic
9.0%
Yakama
0.0
/100
|
#337
Tragic
9.0%
Cheyenne
0.0
/100
|
#338
Tragic
9.4%
Crow
0.0
/100
|
#339
Tragic
9.6%
Yuman
0.0
/100
|
#340
Tragic
9.7%
Pueblo
0.0
/100
|
#341
Tragic
11.1%
Tohono O'odham
0.0
/100
|
#342
Tragic
11.2%
Pima
0.0
/100
|
#343
Tragic
11.4%
Navajo
0.0
/100
|
#344
Tragic
11.9%
Puerto Ricans
0.0
/100
|
#345
Tragic
12.6%
Immigrants from Yemen
0.0
/100
|
#346
Tragic
12.8%
Yup'ik
0.0
/100
|
#347
Tragic
13.4%

Tohono O'odham Married-Couple Family Poverty Correlation Summary

MeasurementTohono O'odham DataMarried-Couple Family Poverty Data
Minimum0.034%5.8%
Maximum100.0%71.6%
Range100.0%65.8%
Mean24.4%23.0%
Median5.8%14.7%
Interquartile 25% (IQ1)2.6%9.4%
Interquartile 75% (IQ3)27.3%31.2%
Interquartile Range (IQR)24.6%21.8%
Standard Deviation (Sample)33.8%18.6%
Standard Deviation (Population)33.1%18.2%

Correlation Details

Tohono O'odham PercentileSample SizeMarried-Couple Family Poverty
[
0.0%
-
0.5%
]
0.034%
56,777,0176.3%
[
0.5%
-
1.0%
]
0.71%
1,353,8647.6%
[
1.0%
-
1.5%
]
1.19%
385,77010.5%
[
1.5%
-
2.0%
]
1.66%
65,69312.1%
[
2.0%
-
2.5%
]
2.25%
11,9627.6%
[
2.5%
-
3.0%
]
2.63%
56,8325.8%
[
3.0%
-
3.5%
]
3.43%
4,48920.3%
[
3.5%
-
4.0%
]
3.81%
1,83554.5%
[
4.0%
-
4.5%
]
4.50%
1,17821.3%
[
4.5%
-
5.0%
]
4.93%
1,82440.0%
[
5.0%
-
5.5%
]
5.18%
96511.5%
[
5.5%
-
6.0%
]
5.77%
5,8209.4%
[
6.5%
-
7.0%
]
6.68%
7,56414.7%
[
8.5%
-
9.0%
]
8.57%
2,40313.1%
[
13.5%
-
14.0%
]
13.66%
45415.1%
[
20.5%
-
21.0%
]
20.52%
3,6216.0%
[
22.5%
-
23.0%
]
22.96%
39250.0%
[
27.0%
-
27.5%
]
27.26%
2,02131.2%
[
66.0%
-
66.5%
]
66.49%
74914.6%
[
78.5%
-
79.0%
]
78.94%
8,43424.5%
[
88.5%
-
89.0%
]
88.67%
35330.3%
[
90.0%
-
90.5%
]
90.37%
18752.2%
[
99.5%
-
100.0%
]
100.00%
28371.6%