Tohono O'odham 4 or more Vehicles in Household
COMPARE
Tohono O'odham
Select to Compare
4 or more Vehicles in Household
Tohono O'odham 4 or more Vehicles in Household
6.6%
4+ VEHICLES AVAILABLE
86.7/ 100
METRIC RATING
135th/ 347
METRIC RANK
Tohono O'odham 4 or more Vehicles in Household Correlation Chart
The statistical analysis conducted on geographies consisting of 58,702,005 people shows a moderate positive correlation between the proportion of Tohono O'odham and percentage of households with 4 or more vehicles available in the United States with a correlation coefficient (R) of 0.403 and weighted average of 6.6%. On average, for every 1% (one percent) increase in Tohono O'odham within a typical geography, there is an increase of 0.14% in percentage of households with 4 or more vehicles available.
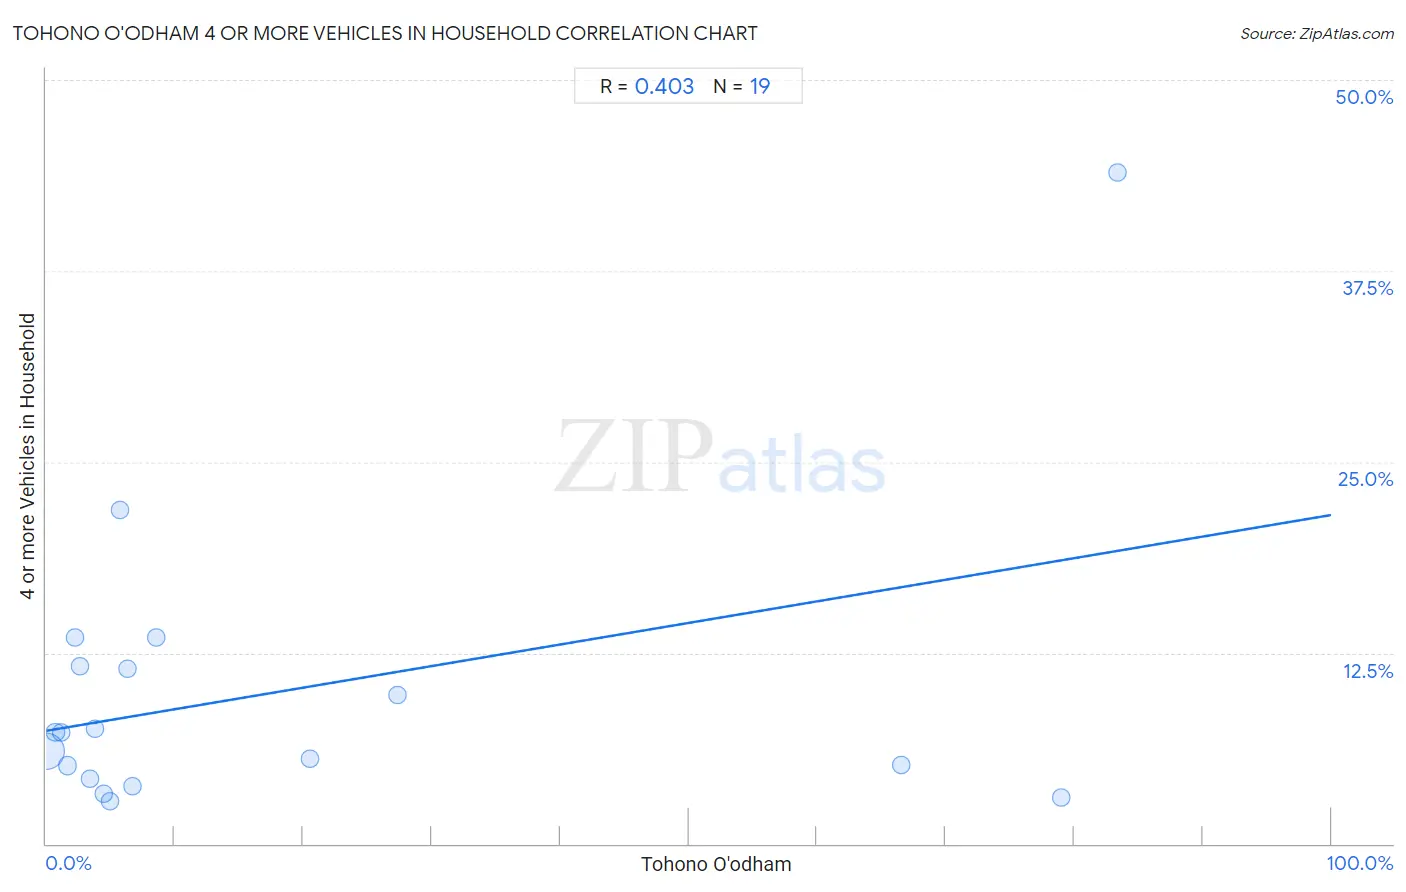
It is essential to understand that the correlation between the percentage of Tohono O'odham and percentage of households with 4 or more vehicles available does not imply a direct cause-and-effect relationship. It remains uncertain whether the presence of Tohono O'odham influences an upward or downward trend in the level of percentage of households with 4 or more vehicles available within an area, or if Tohono O'odham simply ended up residing in those areas with higher or lower levels of percentage of households with 4 or more vehicles available due to other factors.
Demographics Similar to Tohono O'odham by 4 or more Vehicles in Household
In terms of 4 or more vehicles in household, the demographic groups most similar to Tohono O'odham are Ottawa (6.6%, a difference of 0.030%), Armenian (6.6%, a difference of 0.050%), Luxembourger (6.6%, a difference of 0.070%), Immigrants from Netherlands (6.6%, a difference of 0.24%), and French Canadian (6.6%, a difference of 0.27%).
| Demographics | Rating | Rank | 4 or more Vehicles in Household |
| Immigrants from Bolivia | 92.5 /100 | #128 | Exceptional 6.7% |
| Immigrants from England | 92.0 /100 | #129 | Exceptional 6.7% |
| Immigrants from Scotland | 89.0 /100 | #130 | Excellent 6.7% |
| Maltese | 88.4 /100 | #131 | Excellent 6.7% |
| Immigrants from Netherlands | 87.8 /100 | #132 | Excellent 6.6% |
| Armenians | 86.9 /100 | #133 | Excellent 6.6% |
| Ottawa | 86.9 /100 | #134 | Excellent 6.6% |
| Tohono O'odham | 86.7 /100 | #135 | Excellent 6.6% |
| Luxembourgers | 86.4 /100 | #136 | Excellent 6.6% |
| French Canadians | 85.4 /100 | #137 | Excellent 6.6% |
| Italians | 84.5 /100 | #138 | Excellent 6.6% |
| Jordanians | 82.1 /100 | #139 | Excellent 6.6% |
| Slavs | 81.6 /100 | #140 | Excellent 6.6% |
| Australians | 80.8 /100 | #141 | Excellent 6.6% |
| Immigrants from Iraq | 79.4 /100 | #142 | Good 6.5% |
Tohono O'odham 4 or more Vehicles in Household Correlation Summary
| Measurement | Tohono O'odham Data | 4 or more Vehicles in Household Data |
| Minimum | 0.034% | 2.8% |
| Maximum | 83.3% | 43.9% |
| Range | 83.3% | 41.1% |
| Mean | 17.3% | 9.8% |
| Median | 4.9% | 7.3% |
| Interquartile 25% (IQ1) | 2.2% | 4.3% |
| Interquartile 75% (IQ3) | 20.5% | 11.6% |
| Interquartile Range (IQR) | 18.3% | 7.3% |
| Standard Deviation (Sample) | 27.2% | 9.5% |
| Standard Deviation (Population) | 26.5% | 9.3% |
Correlation Details
| Tohono O'odham Percentile | Sample Size | 4 or more Vehicles in Household |
[ 0.0% - 0.5% ] 0.034% | 56,788,285 | 6.1% |
[ 0.5% - 1.0% ] 0.71% | 1,355,417 | 7.3% |
[ 1.0% - 1.5% ] 1.19% | 385,155 | 7.3% |
[ 1.5% - 2.0% ] 1.66% | 66,171 | 5.1% |
[ 2.0% - 2.5% ] 2.25% | 11,962 | 13.5% |
[ 2.5% - 3.0% ] 2.63% | 56,832 | 11.6% |
[ 3.0% - 3.5% ] 3.43% | 5,072 | 4.3% |
[ 3.5% - 4.0% ] 3.81% | 1,835 | 7.5% |
[ 4.0% - 4.5% ] 4.50% | 1,178 | 3.3% |
[ 4.5% - 5.0% ] 4.93% | 1,824 | 2.8% |
[ 5.5% - 6.0% ] 5.77% | 5,424 | 21.8% |
[ 6.0% - 6.5% ] 6.28% | 733 | 11.5% |
[ 6.5% - 7.0% ] 6.68% | 7,564 | 3.8% |
[ 8.5% - 9.0% ] 8.57% | 2,403 | 13.5% |
[ 20.5% - 21.0% ] 20.52% | 3,621 | 5.6% |
[ 27.0% - 27.5% ] 27.30% | 1,564 | 9.7% |
[ 66.0% - 66.5% ] 66.49% | 749 | 5.2% |
[ 78.5% - 79.0% ] 78.94% | 6,012 | 3.0% |
[ 83.0% - 83.5% ] 83.33% | 204 | 43.9% |