Slavic Married-Couple Family Poverty

COMPARE

Slavic
Race
Ancestry
AfghanAfricanAlaska NativeAlaskan AthabascanAlbanianAleutAlsatianAmericanApacheArabArapahoArgentineanArmenianAssyrian/Chaldean/SyriacAustralianAustrianBahamianBangladeshiBarbadianBasqueBelgianBelizeanBermudanBhutaneseBlackfeetBolivianBrazilianBritishBritish West IndianBulgarianBurmeseCajunCambodianCanadianCape VerdeanCarpatho RusynCelticCentral AmericanCentral American IndianCherokeeCheyenneChickasawChileanChineseChippewaChoctawColombianColvilleComancheCosta RicanCreeCreekCroatianCrowCubanCypriotCzechCzechoslovakianDanishDelawareDominicanDutchDutch West IndianEastern EuropeanEcuadorianEgyptianEnglishEstonianEthiopianEuropeanFijianFilipinoFinnishFrenchFrench American IndianFrench CanadianGermanGerman RussianGhanaianGreekGuamanian/ChamorroGuatemalanGuyaneseHaitianHmongHonduranHopiHoumaHungarianIcelanderIndian (Asian)IndonesianInupiatIranianIraqiIrishIroquoisIsraeliItalianJamaicanJapaneseJordanianKenyanKiowaKoreanLaotianLatvianLebaneseLiberianLithuanianLumbeeLuxembourgerMacedonianMalaysianMalteseMarshalleseMenomineeMexicanMexican American IndianMongolianMoroccanNative HawaiianNavajoNepaleseNew ZealanderNicaraguanNigerianNorthern EuropeanNorwegianOkinawanOsageOttawaPaiutePakistaniPalestinianPanamanianParaguayanPennsylvania GermanPeruvianPimaPolishPortuguesePotawatomiPuebloPuerto RicanPuget Sound SalishRomanianRussianSalvadoranSamoanScandinavianScotch-IrishScottishSeminoleSenegaleseSerbianShoshoneSierra LeoneanSiouxSlavicSlovakSloveneSomaliSouth AfricanSouth AmericanSouth American IndianSoviet UnionSpaniardSpanishSpanish AmericanSpanish American IndianSri LankanSubsaharan AfricanSudaneseSwedishSwissSyrianTaiwaneseThaiTlingit-HaidaTohono O'OdhamTonganTrinidadian and TobagonianTsimshianTurkishU.S. Virgin IslanderUgandanUkrainianUruguayanUteVenezuelanVietnameseWelshWest IndianYakamaYaquiYugoslavianYumanYup'ikZimbabwean
Immigration
NonimmigrantsImmigrantsAfghanistanAfricaAlbaniaArgentinaArmeniaAsiaAustraliaAustriaBahamasBangladeshBarbadosBelarusBelgiumBelizeBoliviaBosnia and HerzegovinaBrazilBulgariaBurma/MyanmarCabo VerdeCambodiaCameroonCanadaCaribbeanCentral AmericaChileChinaColombiaCongoCosta RicaCroatiaCubaCzechoslovakiaDenmarkDominicaDominican RepublicEastern AfricaEastern AsiaEastern EuropeEcuadorEgyptEl SalvadorEnglandEritreaEthiopiaEuropeFijiFranceGermanyGhanaGreeceGrenadaGuatemalaGuyanaHaitiHondurasHong KongHungaryIndiaIndonesiaIranIraqIrelandIsraelItalyJamaicaJapanJordanKazakhstanKenyaKoreaKuwaitLaosLatin AmericaLatviaLebanonLiberiaLithuaniaMalaysiaMexicoMicronesiaMiddle AfricaMoldovaMoroccoNepalNetherlandsNicaraguaNigeriaNorth AmericaNorth MacedoniaNorthern AfricaNorthern EuropeNorwayOceaniaPakistanPanamaPeruPhilippinesPolandPortugalRomaniaRussiaSaudi ArabiaScotlandSenegalSerbiaSierra LeoneSingaporeSomaliaSouth AfricaSouth AmericaSouth Central AsiaSouth Eastern AsiaSouthern EuropeSpainSri LankaSt. Vincent and the GrenadinesSudanSwedenSwitzerlandSyriaTaiwanThailandTrinidad and TobagoTurkeyUgandaUkraineUruguayUzbekistanVenezuelaVietnamWest IndiesWestern AfricaWestern AsiaWestern EuropeYemenZaireZimbabweAzores
Select to Compare
Race
Ancestry
AfghanAfricanAlaska NativeAlaskan AthabascanAlbanianAleutAlsatianAmericanApacheArabArapahoArgentineanArmenianAssyrian/Chaldean/SyriacAustralianAustrianBahamianBangladeshiBarbadianBasqueBelgianBelizeanBermudanBhutaneseBlackfeetBolivianBrazilianBritishBritish West IndianBulgarianBurmeseCajunCambodianCanadianCape VerdeanCarpatho RusynCelticCentral AmericanCentral American IndianCherokeeCheyenneChickasawChileanChineseChippewaChoctawColombianColvilleComancheCosta RicanCreeCreekCroatianCrowCubanCypriotCzechCzechoslovakianDanishDelawareDominicanDutchDutch West IndianEastern EuropeanEcuadorianEgyptianEnglishEstonianEthiopianEuropeanFijianFilipinoFinnishFrenchFrench American IndianFrench CanadianGermanGerman RussianGhanaianGreekGuamanian/ChamorroGuatemalanGuyaneseHaitianHmongHonduranHopiHoumaHungarianIcelanderIndian (Asian)IndonesianInupiatIranianIraqiIrishIroquoisIsraeliItalianJamaicanJapaneseJordanianKenyanKiowaKoreanLaotianLatvianLebaneseLiberianLithuanianLumbeeLuxembourgerMacedonianMalaysianMalteseMarshalleseMenomineeMexicanMexican American IndianMongolianMoroccanNative HawaiianNavajoNepaleseNew ZealanderNicaraguanNigerianNorthern EuropeanNorwegianOkinawanOsageOttawaPaiutePakistaniPalestinianPanamanianParaguayanPennsylvania GermanPeruvianPimaPolishPortuguesePotawatomiPuebloPuerto RicanPuget Sound SalishRomanianRussianSalvadoranSamoanScandinavianScotch-IrishScottishSeminoleSenegaleseSerbianShoshoneSierra LeoneanSiouxSlovakSloveneSomaliSouth AfricanSouth AmericanSouth American IndianSoviet UnionSpaniardSpanishSpanish AmericanSpanish American IndianSri LankanSubsaharan AfricanSudaneseSwedishSwissSyrianTaiwaneseThaiTlingit-HaidaTohono O'OdhamTonganTrinidadian and TobagonianTsimshianTurkishU.S. Virgin IslanderUgandanUkrainianUruguayanUteVenezuelanVietnameseWelshWest IndianYakamaYaquiYugoslavianYumanYup'ikZimbabwean
Immigration
NonimmigrantsImmigrantsAfghanistanAfricaAlbaniaArgentinaArmeniaAsiaAustraliaAustriaBahamasBangladeshBarbadosBelarusBelgiumBelizeBoliviaBosnia and HerzegovinaBrazilBulgariaBurma/MyanmarCabo VerdeCambodiaCameroonCanadaCaribbeanCentral AmericaChileChinaColombiaCongoCosta RicaCroatiaCubaCzechoslovakiaDenmarkDominicaDominican RepublicEastern AfricaEastern AsiaEastern EuropeEcuadorEgyptEl SalvadorEnglandEritreaEthiopiaEuropeFijiFranceGermanyGhanaGreeceGrenadaGuatemalaGuyanaHaitiHondurasHong KongHungaryIndiaIndonesiaIranIraqIrelandIsraelItalyJamaicaJapanJordanKazakhstanKenyaKoreaKuwaitLaosLatin AmericaLatviaLebanonLiberiaLithuaniaMalaysiaMexicoMicronesiaMiddle AfricaMoldovaMoroccoNepalNetherlandsNicaraguaNigeriaNorth AmericaNorth MacedoniaNorthern AfricaNorthern EuropeNorwayOceaniaPakistanPanamaPeruPhilippinesPolandPortugalRomaniaRussiaSaudi ArabiaScotlandSenegalSerbiaSierra LeoneSingaporeSomaliaSouth AfricaSouth AmericaSouth Central AsiaSouth Eastern AsiaSouthern EuropeSpainSri LankaSt. Vincent and the GrenadinesSudanSwedenSwitzerlandSyriaTaiwanThailandTrinidad and TobagoTurkeyUgandaUkraineUruguayUzbekistanVenezuelaVietnamWest IndiesWestern AfricaWestern AsiaWestern EuropeYemenZaireZimbabweAzores
Married-Couple Family Poverty
Income
Poverty
Unemployment
Labor Participation
Family Structure
Vehicle Availability
Education Level
Disability

Slavic Married-Couple Family Poverty
Exceptional

4.4%
POVERTY | MARRIED-COUPLE FAMILIES
99.4/ 100
METRIC RATING
68th/ 347
METRIC RANK

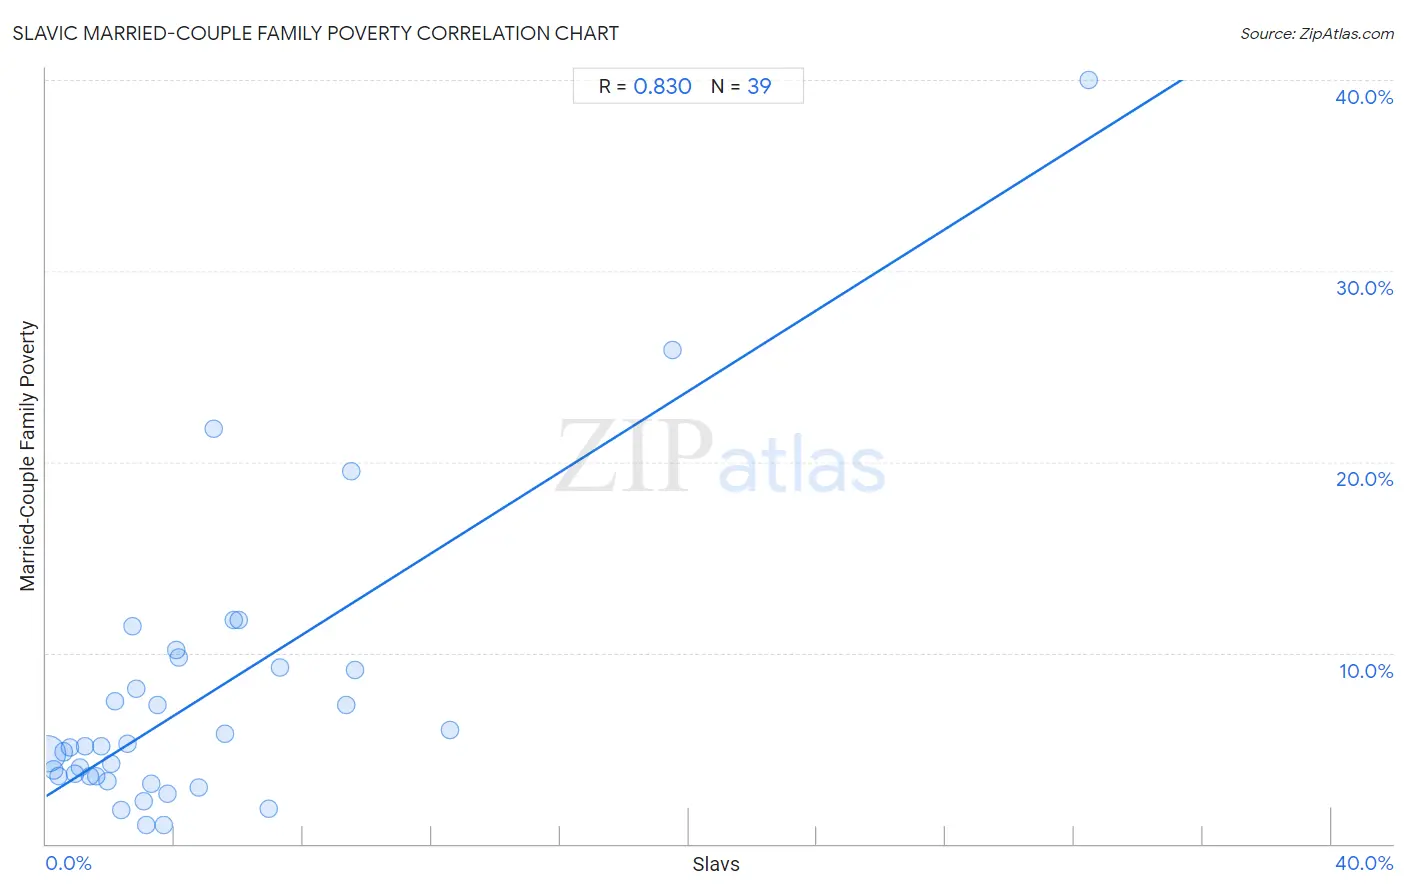
Slavic Married-Couple Family Poverty Correlation Chart

The statistical analysis conducted on geographies consisting of 268,876,285 people shows a very strong positive correlation between the proportion of Slavs and poverty level among married-couple families in the United States with a correlation coefficient (R) of 0.830 and weighted average of 4.4%. On average, for every 1% (one percent) increase in Slavs within a typical geography, there is an increase of 1.1% in poverty level among married-couple families.
Slavic Married-Couple Family Poverty
It is essential to understand that the correlation between the percentage of Slavs and poverty level among married-couple families does not imply a direct cause-and-effect relationship. It remains uncertain whether the presence of Slavs influences an upward or downward trend in the level of poverty level among married-couple families within an area, or if Slavs simply ended up residing in those areas with higher or lower levels of poverty level among married-couple families due to other factors.

Demographics Similar to Slavs by Married-Couple Family Poverty

In terms of married-couple family poverty, the demographic groups most similar to Slavs are Immigrants from Canada (4.4%, a difference of 0.010%), New Zealander (4.4%, a difference of 0.010%), Immigrants from Serbia (4.4%, a difference of 0.060%), Immigrants from Korea (4.5%, a difference of 0.14%), and Macedonian (4.4%, a difference of 0.19%).
DemographicsRating | RankMarried-Couple Family Poverty
Okinawans
99.6
/100
|
#61
Exceptional
4.4%
Immigrants from Australia
99.6
/100
|
#62
Exceptional
4.4%
Immigrants from Sri Lanka
99.6
/100
|
#63
Exceptional
4.4%
Immigrants from Bulgaria
99.5
/100
|
#64
Exceptional
4.4%
Macedonians
99.4
/100
|
#65
Exceptional
4.4%
Immigrants from Serbia
99.4
/100
|
#66
Exceptional
4.4%
Immigrants from Canada
99.4
/100
|
#67
Exceptional
4.4%
Slavs
99.4
/100
|
#68
Exceptional
4.4%
New Zealanders
99.4
/100
|
#69
Exceptional
4.4%
Immigrants from Korea
99.4
/100
|
#70
Exceptional
4.5%
Immigrants from North America
99.3
/100
|
#71
Exceptional
4.5%
Immigrants from England
99.3
/100
|
#72
Exceptional
4.5%
Ukrainians
99.2
/100
|
#73
Exceptional
4.5%
Immigrants from Austria
99.2
/100
|
#74
Exceptional
4.5%
Cambodians
99.2
/100
|
#75
Exceptional
4.5%

Slavic Married-Couple Family Poverty Correlation Summary

MeasurementSlavic DataMarried-Couple Family Poverty Data
Minimum0.050%0.99%
Maximum32.5%40.0%
Range32.4%39.0%
Mean4.9%7.6%
Median3.1%5.1%
Interquartile 25% (IQ1)1.5%3.5%
Interquartile 75% (IQ3)5.9%9.3%
Interquartile Range (IQR)4.3%5.8%
Standard Deviation (Sample)6.0%7.6%
Standard Deviation (Population)5.9%7.5%

Correlation Details

Slavic PercentileSample SizeMarried-Couple Family Poverty
[
0.0%
-
0.5%
]
0.050%
240,389,3384.7%
[
0.0%
-
0.5%
]
0.22%
19,212,3683.9%
[
0.0%
-
0.5%
]
0.39%
5,108,1743.6%
[
0.5%
-
1.0%
]
0.56%
1,806,9704.8%
[
0.5%
-
1.0%
]
0.73%
992,7985.0%
[
0.5%
-
1.0%
]
0.89%
455,8543.7%
[
1.0%
-
1.5%
]
1.04%
232,0684.0%
[
1.0%
-
1.5%
]
1.22%
229,4845.1%
[
1.0%
-
1.5%
]
1.36%
125,5083.5%
[
1.5%
-
2.0%
]
1.54%
118,5783.5%
[
1.5%
-
2.0%
]
1.71%
37,3085.1%
[
1.5%
-
2.0%
]
1.89%
40,7733.3%
[
2.0%
-
2.5%
]
2.04%
26,6864.2%
[
2.0%
-
2.5%
]
2.16%
15,5597.5%
[
2.0%
-
2.5%
]
2.32%
35,8031.8%
[
2.5%
-
3.0%
]
2.51%
2,3105.2%
[
2.5%
-
3.0%
]
2.69%
70711.4%
[
2.5%
-
3.0%
]
2.81%
9,8658.1%
[
3.0%
-
3.5%
]
3.05%
3,5392.2%
[
3.0%
-
3.5%
]
3.12%
11,7441.0%
[
3.0%
-
3.5%
]
3.28%
2,6563.1%
[
3.0%
-
3.5%
]
3.46%
2,7427.3%
[
3.5%
-
4.0%
]
3.66%
1,1190.99%
[
3.5%
-
4.0%
]
3.77%
2,6012.6%
[
4.0%
-
4.5%
]
4.06%
41910.1%
[
4.0%
-
4.5%
]
4.14%
2909.8%
[
4.5%
-
5.0%
]
4.74%
2,1942.9%
[
5.0%
-
5.5%
]
5.20%
1,00021.7%
[
5.5%
-
6.0%
]
5.55%
5955.7%
[
5.5%
-
6.0%
]
5.85%
37611.7%
[
6.0%
-
6.5%
]
6.01%
36611.7%
[
6.5%
-
7.0%
]
6.94%
2,4931.9%
[
7.0%
-
7.5%
]
7.29%
7689.3%
[
9.0%
-
9.5%
]
9.35%
1,1127.3%
[
9.0%
-
9.5%
]
9.48%
30619.5%
[
9.5%
-
10.0%
]
9.62%
2919.1%
[
12.5%
-
13.0%
]
12.56%
3985.9%
[
19.0%
-
19.5%
]
19.49%
70325.8%
[
32.0%
-
32.5%
]
32.46%
42240.0%