Slavic 3 or more Vehicles in Household
COMPARE
Slavic
Select to Compare
3 or more Vehicles in Household
Slavic 3 or more Vehicles in Household
20.4%
3+ VEHICLES AVAILABLE
92.1/ 100
METRIC RATING
126th/ 347
METRIC RANK
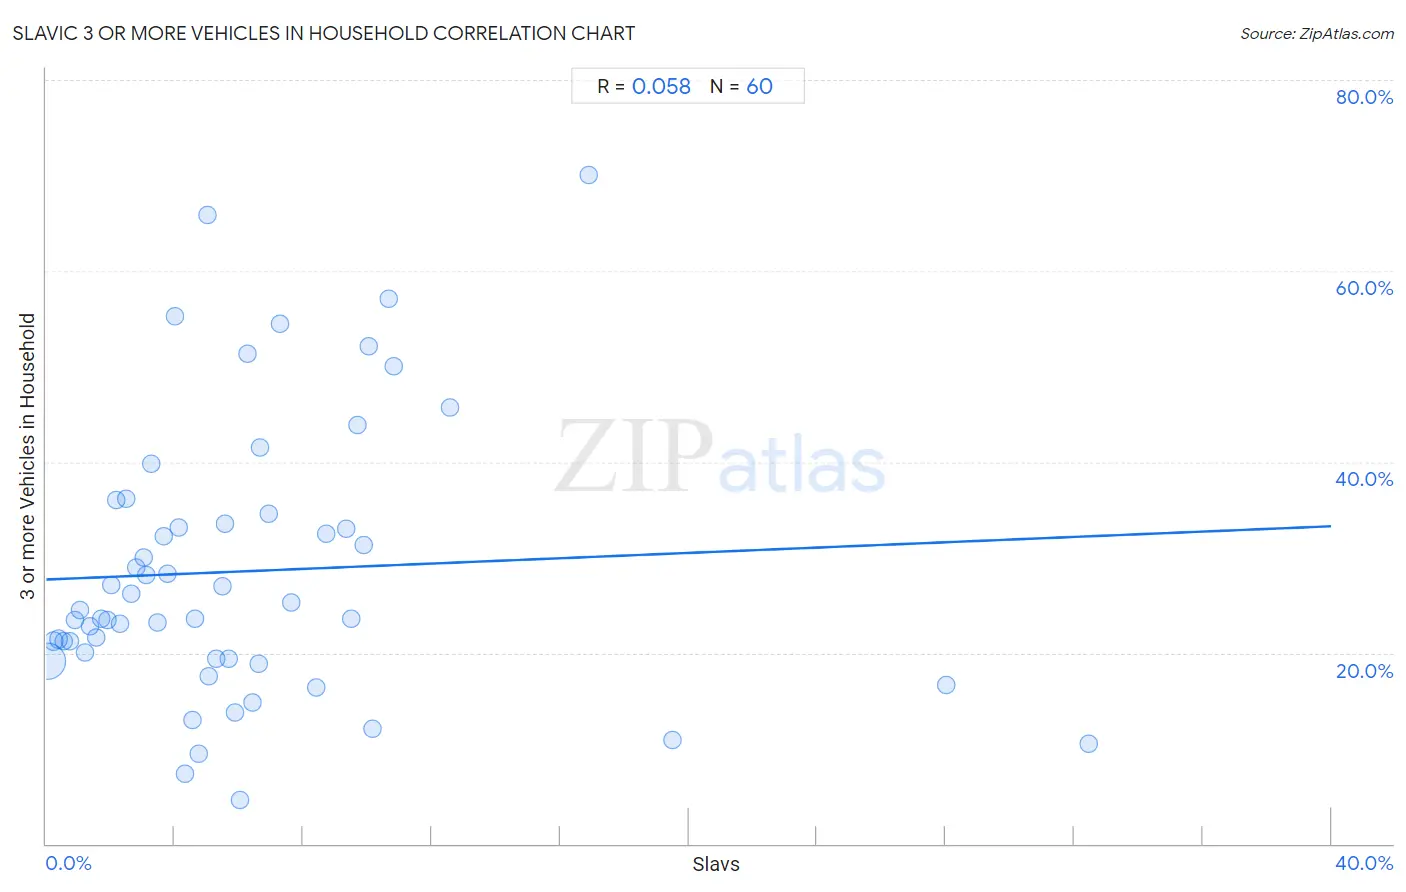
Slavic 3 or more Vehicles in Household Correlation Chart
The statistical analysis conducted on geographies consisting of 270,770,751 people shows a slight positive correlation between the proportion of Slavs and percentage of households with 3 or more vehicles available in the United States with a correlation coefficient (R) of 0.058 and weighted average of 20.4%. On average, for every 1% (one percent) increase in Slavs within a typical geography, there is an increase of 0.14% in percentage of households with 3 or more vehicles available.
It is essential to understand that the correlation between the percentage of Slavs and percentage of households with 3 or more vehicles available does not imply a direct cause-and-effect relationship. It remains uncertain whether the presence of Slavs influences an upward or downward trend in the level of percentage of households with 3 or more vehicles available within an area, or if Slavs simply ended up residing in those areas with higher or lower levels of percentage of households with 3 or more vehicles available due to other factors.
Demographics Similar to Slavs by 3 or more Vehicles in Household
In terms of 3 or more vehicles in household, the demographic groups most similar to Slavs are Immigrants from Bolivia (20.4%, a difference of 0.030%), New Zealander (20.4%, a difference of 0.20%), Immigrants from Netherlands (20.4%, a difference of 0.21%), Central American (20.5%, a difference of 0.24%), and German Russian (20.5%, a difference of 0.42%).
| Demographics | Rating | Rank | 3 or more Vehicles in Household |
| Immigrants from Latin America | 94.5 /100 | #119 | Exceptional 20.5% |
| Maltese | 93.9 /100 | #120 | Exceptional 20.5% |
| Immigrants from Thailand | 93.8 /100 | #121 | Exceptional 20.5% |
| German Russians | 93.7 /100 | #122 | Exceptional 20.5% |
| Immigrants from Korea | 93.7 /100 | #123 | Exceptional 20.5% |
| Central Americans | 93.1 /100 | #124 | Exceptional 20.5% |
| Immigrants from Netherlands | 92.9 /100 | #125 | Exceptional 20.4% |
| Slavs | 92.1 /100 | #126 | Exceptional 20.4% |
| Immigrants from Bolivia | 92.0 /100 | #127 | Exceptional 20.4% |
| New Zealanders | 91.3 /100 | #128 | Exceptional 20.4% |
| Zimbabweans | 88.7 /100 | #129 | Excellent 20.3% |
| Greeks | 88.6 /100 | #130 | Excellent 20.3% |
| Immigrants from Asia | 88.1 /100 | #131 | Excellent 20.2% |
| Immigrants from Canada | 87.8 /100 | #132 | Excellent 20.2% |
| Immigrants from North America | 87.8 /100 | #133 | Excellent 20.2% |
Slavic 3 or more Vehicles in Household Correlation Summary
| Measurement | Slavic Data | 3 or more Vehicles in Household Data |
| Minimum | 0.050% | 4.6% |
| Maximum | 32.5% | 70.0% |
| Range | 32.4% | 65.4% |
| Mean | 6.2% | 28.5% |
| Median | 4.9% | 24.0% |
| Interquartile 25% (IQ1) | 2.4% | 19.4% |
| Interquartile 75% (IQ3) | 8.0% | 34.0% |
| Interquartile Range (IQR) | 5.6% | 14.6% |
| Standard Deviation (Sample) | 6.0% | 14.4% |
| Standard Deviation (Population) | 5.9% | 14.3% |
Correlation Details
| Slavic Percentile | Sample Size | 3 or more Vehicles in Household |
[ 0.0% - 0.5% ] 0.050% | 241,060,485 | 19.2% |
[ 0.0% - 0.5% ] 0.22% | 19,794,082 | 21.2% |
[ 0.0% - 0.5% ] 0.39% | 5,286,141 | 21.4% |
[ 0.5% - 1.0% ] 0.56% | 1,937,916 | 21.3% |
[ 0.5% - 1.0% ] 0.73% | 1,067,556 | 21.2% |
[ 0.5% - 1.0% ] 0.89% | 521,179 | 23.4% |
[ 1.0% - 1.5% ] 1.04% | 281,520 | 24.5% |
[ 1.0% - 1.5% ] 1.22% | 266,034 | 20.0% |
[ 1.0% - 1.5% ] 1.36% | 146,866 | 22.7% |
[ 1.5% - 2.0% ] 1.54% | 136,366 | 21.6% |
[ 1.5% - 2.0% ] 1.71% | 42,737 | 23.5% |
[ 1.5% - 2.0% ] 1.89% | 45,605 | 23.4% |
[ 2.0% - 2.5% ] 2.04% | 36,918 | 27.1% |
[ 2.0% - 2.5% ] 2.18% | 20,446 | 36.0% |
[ 2.0% - 2.5% ] 2.31% | 36,891 | 23.1% |
[ 2.5% - 3.0% ] 2.50% | 4,673 | 36.2% |
[ 2.5% - 3.0% ] 2.65% | 5,818 | 26.2% |
[ 2.5% - 3.0% ] 2.82% | 23,398 | 28.9% |
[ 3.0% - 3.5% ] 3.05% | 3,539 | 30.0% |
[ 3.0% - 3.5% ] 3.12% | 12,305 | 28.2% |
[ 3.0% - 3.5% ] 3.28% | 3,108 | 39.8% |
[ 3.0% - 3.5% ] 3.47% | 3,571 | 23.2% |
[ 3.5% - 4.0% ] 3.67% | 3,184 | 32.2% |
[ 3.5% - 4.0% ] 3.77% | 4,404 | 28.3% |
[ 4.0% - 4.5% ] 4.02% | 921 | 55.3% |
[ 4.0% - 4.5% ] 4.14% | 290 | 33.1% |
[ 4.0% - 4.5% ] 4.32% | 672 | 7.3% |
[ 4.5% - 5.0% ] 4.54% | 2,910 | 13.0% |
[ 4.5% - 5.0% ] 4.63% | 691 | 23.5% |
[ 4.5% - 5.0% ] 4.74% | 2,194 | 9.5% |
[ 5.0% - 5.5% ] 5.00% | 200 | 65.9% |
[ 5.0% - 5.5% ] 5.05% | 970 | 17.5% |
[ 5.0% - 5.5% ] 5.28% | 2,536 | 19.4% |
[ 5.0% - 5.5% ] 5.48% | 420 | 27.0% |
[ 5.5% - 6.0% ] 5.55% | 595 | 33.5% |
[ 5.5% - 6.0% ] 5.69% | 686 | 19.4% |
[ 5.5% - 6.0% ] 5.89% | 526 | 13.8% |
[ 6.0% - 6.5% ] 6.02% | 498 | 4.6% |
[ 6.0% - 6.5% ] 6.25% | 304 | 51.3% |
[ 6.0% - 6.5% ] 6.41% | 702 | 14.8% |
[ 6.5% - 7.0% ] 6.62% | 665 | 18.8% |
[ 6.5% - 7.0% ] 6.67% | 150 | 41.5% |
[ 6.5% - 7.0% ] 6.94% | 2,493 | 34.6% |
[ 7.0% - 7.5% ] 7.29% | 768 | 54.5% |
[ 7.5% - 8.0% ] 7.61% | 197 | 25.3% |
[ 8.0% - 8.5% ] 8.42% | 95 | 16.3% |
[ 8.5% - 9.0% ] 8.72% | 149 | 32.5% |
[ 9.0% - 9.5% ] 9.35% | 1,251 | 33.1% |
[ 9.0% - 9.5% ] 9.48% | 306 | 23.5% |
[ 9.5% - 10.0% ] 9.69% | 949 | 43.9% |
[ 9.5% - 10.0% ] 9.87% | 223 | 31.3% |
[ 10.0% - 10.5% ] 10.03% | 309 | 52.2% |
[ 10.0% - 10.5% ] 10.14% | 365 | 12.1% |
[ 10.5% - 11.0% ] 10.67% | 75 | 57.1% |
[ 10.5% - 11.0% ] 10.83% | 120 | 50.0% |
[ 12.5% - 13.0% ] 12.55% | 462 | 45.7% |
[ 16.5% - 17.0% ] 16.88% | 154 | 70.0% |
[ 19.0% - 19.5% ] 19.50% | 995 | 10.9% |
[ 28.0% - 28.5% ] 28.02% | 746 | 16.7% |
[ 32.0% - 32.5% ] 32.46% | 422 | 10.5% |